Preface
This is a re-implementation of a blog series I maintained while working as an undergraduate student researcher in the inaugural ProHealth Research Experience for Undergraduates (REU). I’ve tried not to modify the content; but have corrected some spelling errors, tweaked some formatting, corrected links that pointed to now-defunct web pages, and cleaned up the tables.1 The original WordPress version: “Alexander’s Blog” can be read here, but it may not exist forever.2
It recounts my journey while learning to do research, the lessons I learned from my mentors (including Professors Katie Siek and Sriraam Natarajan, and Devendra Singh Dhami), and lessons I learned along the way from my friends and fellow students. The project was built around data mining online data sources to automatically distinguish drug-drug interactions.
This covers 9/10 weeks of the program. Our final week ended with a Friday poster presentation and many students traveled to the airport immediately after—I never wrote a conclusion. As a brief reflection: my REU experience prepared me for many of the challenges that I would experience in graduate school. I learned to manage my time on research projects, take on complex problems, and talk through these with my colleagues. I met mentors who continue to inspire and instruct my thoughts.
Week 1
Monday, May 23, 2016
Reporting in for the first day of the REU, covering: a summary of “A Craft Approach to Health Awareness in Children,” discussion about the day, citation managers, and documentation decisions.3
Summary: “A Craft Approach to Health Awareness in Children” aims to combat childhood obesity and sedentary lifestyles with health tools that children can build and create, encouraging them to be more active. Furthermore, this is an effort to help children understand the importance of maintaining a positive lifestyle from a perspective they can enjoy. There was also a study in with middle school students that intended to test some of the hypotheses from the study.
Today: The first day started at 8am in Willkie Center Building, where Dr. Kylie Hartley and Dr. Leslie Liu conducted preliminary interviews with us, finding out our thoughts and where we are currently in order to measure our progress along the way. After a few tours around campus we met our advisers for lunch in the Tudor Room, and met at Informatics East to discuss plans for the week.
Citation Managers: Mendeley was highly recommended, and I made sure I could look up some papers on Google Scholar to find out forward citations. Backward citations are still fairly straightforward to find.
Tuesday, May 24, 2016
Day two of Research Bootcamp. We covered topics including GitHub, LaTeX, ethnography, Tableau, and ethics.
Observation Exercise: this one would likely be considered exempt under IRB, because it is observation in a public place.
Chipotle Observation: Begin at 17:02, 24 May 2016
- 0:00 – I arrive, choosing to sit in the high corner table in full view of the entire restaurant and both entrances. A couple sits in a corner booth and a young woman orders food at the counter. No one is looking at their phones.
- 3:00 – The young woman walked outside after receiving her food, a staff member makes the round and wipes tables, no one looks at their phones.
- 4:41 – A tall young man with dark hair and a blue shirt walks in from stage right, he orders at the counter.
- 5:20 – Two men exit the kitchen, likely having been relieved from a previous shift.
- 5:48 – Another man of similar age and height enters, though he wears a grey tank top. He orders at the counter while the previous man prepares to receive his food.
- 7:27 – Both men (having food) pack their meal to go and promptly exit the restaurant.
- 10:26 – The restaurant is quiet, another worker retrieves some trays and checks for trash that hides in between cracks of the tables.
- 11:55 – A slightly shorter man with curly brown hair and a plaid shirt walks up to the counter and orders a burrito.
- 14:27 – The man waits at the register for his food and takes his hand in and out of his pockets, seeming as if he is debating whether or not to take his phone from his pocket.
- 15:20 – Two men enter the restaurant moments apart from one another, the latter (with short hair and a plaid blue shirt) has to wait while the person ahead of him is served. He stands close to the counter, waiting his turn, and turns a white iPhone over in his hand, neglecting to turn on the screen but observing it nonetheless. His face is expressionless, mostly wanting to pass the awkward downtime rather than wait.
- 17:02 – A mother and her two sons walk in. The oldest orders first and leans against the railing by the counter and takes out a black android phone (Samsung or HTC), he scrolls through a page before the woman at the counter hands him his cup. He jumps slightly, quickly returns the phone to his pocket, takes the cup, then moves on to the soda fountain.
- 19:46 – The family finds their way to a table in the middle of the restaurant. The younger child hunches over slightly while typing quickly on a silver iPhone, his expression seems emotionless. When his brother returns to the table the phones are stowed and the three enjoy their food with muted conversation.
Wednesday, May 25, 2016
Day three of the research experience exposed us to some cool technologies such as the laser cutter, 3D printer, and electronic tape for circuits.
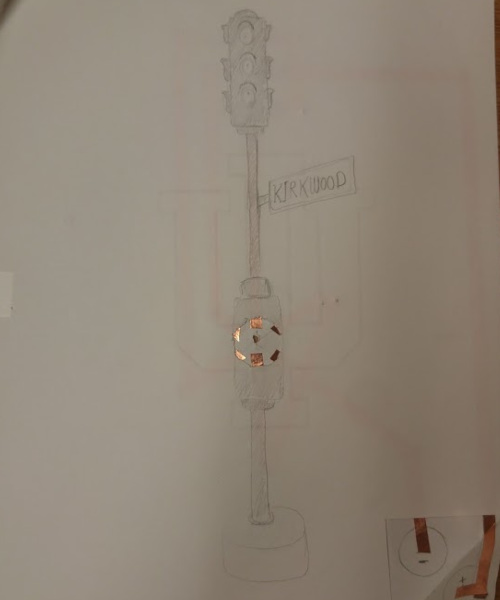
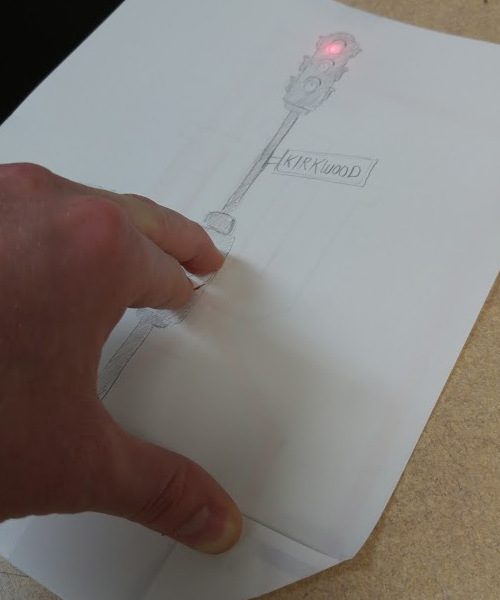
My circuit creation used three LEDs (red, yellow, and green) and a rotating switch to create a stoplight that switches between the three colors. I sandwiched the circuitry between two sheets of paper, then drew the image on the top one. The bottom corner I’m folding down in the picture contains a battery that can also be switched on and off.
“Relational Learning for Sustainable Health”
- sustainable healthcare requires better value with lower cost. Predictive models can help deliver this. There are three areas machine learning can definitely be applied in: heart disease, altzheimer’s, and finding adverse drug effects in electronic health records.
- Still needs to answer three questions: what diseases is a patient likely to have, how do they change their lifestyle, and what could be caused by these changes? “Statistical Relational Learning” – used on heart disease study, good for noisy models. Socioeconomic factors play a huge role in the health of the population (and can now be quantified). Risk factors in early adulthood are the most important for predicting risks later in life.
- Previous studies using machine learning or network analysis on brains with alzheimers have had difficulty because autism is a spectrum rather than a discrete on/off state. This study considers three categories: AD vs MC vs CN (alzheimer’s disease, …, cognitively normal).
- Reverse Machine Learning was used for predicting adverse drug effects, which allows the algorithms to discover relations between causes and effects with any drug (ex: Plavix + Prilosic = increased risk of stroke). Learning in reverse is meant to be helpful when labels are unknown.
“Security and Privacy in Health”
- k-Anonymity: A model for Protecting Privacy
- Common Pitfalls in Writing about Security and Privacy Human Subjects Experiments, and How to Avoid Them
- Uniqueness and How it Impacts Privacy in Health Related Social Science Datasets
Week 2
Week-at-a-glance (hours include time spent in the office):
| Date | In - Out | Total Hours | Minutes of Wall Sits | Caffeine Drank |
|---|---|---|---|---|
| Tuesday, 2016-05-31 | 7:46am – 4:32pm | 8hr46min | 4 minutes | 545 mg |
| Wednesday, 2016-06-01 | 7:47am – 5:03pm | 9hr17min | 3 minutes | 455 mg |
| Thursday, 2016-06-02 | 7:55am – 3:59pm | 8hr12min | 3 minutes | 273 mg |
| Friday, 2016-06-03 | 9:20am – 5:25pm | 8hr5min | 0min | 182 mg |
Tuesday, May 31, 2016
Professor Natarajan gave us Monday off on account of the holiday, but Tuesday began similar to how last Friday ended: reading papers and grounding my knowledge. STARAI Lab met at 10am, all of the summer researchers met and Professor discussed his research, recap:
“80% of people should understand 80% of your talk.” “Work with rich, noisy, structured data.” “Standard machine learning: not a fixed-length feature vector, multiple attributes per example, relations extend across examples.”
Multi-relational data (fol) + uncertain data (stat) = statistical-relational models of learning (SRL) (Bresse, Bacchus, Charniak, Glesner, Goldman, Koller, Poole, Wellman)
I still wouldn’t consider myself ‘experienced’ with reading academic papers, and between the unfamiliar topics and the general difficulty my pace was a bit slow. The four papers (Inductive Logic Programming; Inductive Logic Programming: Theories and Methods; Gradient-based boosting for statistical relational learning: The relational dependency network case; Markov Logic: An Interface Layer for Artificial Intelligence) totaled to 265 pages. It became easier as it went, but I still consider this to be an area greatly in need of improvement.
Wednesday, June 1, 2016
Almost overnight it seems like the papers make more sense to me. Though they were shorter I knocked out four by 11am. At 11:25 Professor asked me to meet him, and we discussed what I’d been reading, my interest in graduate school, and he offered a brief description of what he wanted me to work on.
The main work we’ve been doing has mapped drugs to events, but now I’d like you to find a set of drugs with common side effects.
event(d1 ... dn, e1 ... en). Look into Python scripts for pulling abstracts from PubMed and FDA Alerts.
This was a very different direction from what I was anticipating. I took some
time to look over my notes from the discussion, feeling briefly overwhelmed and
fascinated that I was heading toward a research area that was mostly unknown.
Professor Katie Siek gave a talk on “Reading Papers, Design Notebooks” that
stalled my work for an hour, but left me feeling confident that I could proceed.
Taking her advice, the only way I could start in a new area was by collecting
knowledge and having a plan for how to tackle it. I did some quick googling to get a
broad feel for what resources existed, then outlined the next two days for
understanding the problem and writing my scripts.
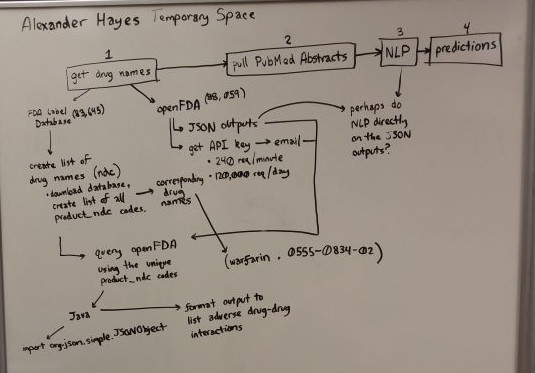
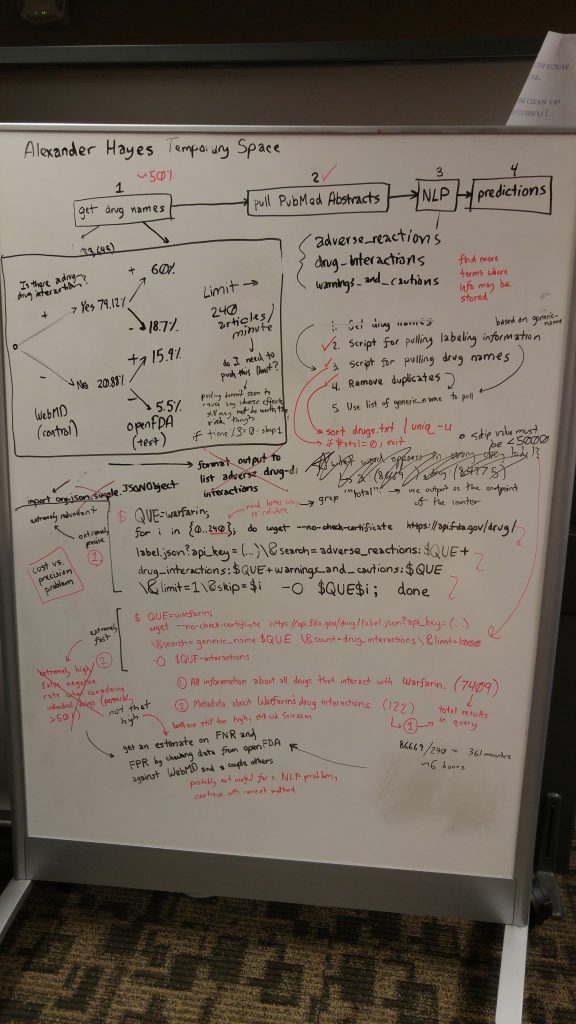
I haven’t found much on machine learning + drug-drug interactions (reevaluate this later), but it’s a pretty big topic in organic chemistry and medicine. The FDA has a fairly extensive slide-deck for training on this topic, but one answer simply invoked many more questions. ~90% of drugs are metabolized by cytochrome p450 enzymes, of which there are 5-6 isoforms found in different quantities in the liver. “Important interactions between drugs can be predicted by using lists of drugs that are inhibitors or inducers of that enzyme. This simplifies the search for interacting drugs and provides a framework for prediction of interactions.” Because there are limited quantities of these enzymes, adverse drug-drug interactions typically occur when one (of multiple drugs) uses up an enzyme and doesn’t allow another to be metabolized, resulting in another drug building up to toxic levels. However, gene expression (or over or under) can often cause greater or lower amounts of these enzymes to exist, which explains why some people may be affected while others are not.
Thursday, June 2, 2016
I had a bit of a breakthrough this morning. After modifying some of Lars Arvestad’s code (GitHub) I can pull PubMed abstracts through the command line, now automating this process should be fairly easy.
$ export PERL5LIB=$PERL5LIB:/lib
$ pmsearch -t 800 -d 50 cytochrome+p450 | pmid2text -a -i > cytochrome+p450.txt
In the example above, the top 50 articles from the last 800 days are pulled, converted to text with abstracts and formatted to not include indentation, then output to a .txt file that we can do some NLP on. (refer to “A Novel Method for Adverse Drug Event Extraction from Text” for explanation on the top 50 articles and the 800 day time frame).
Savannah and I met with Dr. Natarajan at noon, establishing the full outline for the project and our progress on drug-drug interactions and associated projects. I demoed the ability to pull abstracts by showing Dr. Natarajan all of his papers on PubMed.
Though I had an extremely productive morning, I felt like I hit a roadblock in the afternoon. My original prediction was that pulling the abstracts would be the difficult part while compiling a list of drugs would be fairly straightforward. The FDA has an open Drug Label Database that includes a huge wealth of information, but after some basic searches it appears that the opposite of my prediction is true: this would be the difficult part. While the information in the database is extensive, it appears to be massively incomplete.
Friday, June 3, 2016
ProHealth had a 10am meeting to touch base on where everyone was in their respective research. Overall everyone seemed pretty positive, but I’m certainly not alone with roadblocks. I went over some of my work, but made it clear that there are some challenges I’ll need to work through.
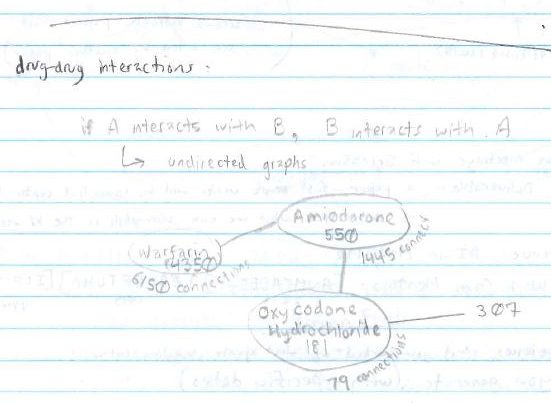
I spent the next few hours reading through openFDA while working with the Drug Label Database. I considered three drugs (Warfarin oral, Amiodarone oral, and Oxycodone Hydrochloride) as appropriate for testing because Warfarin and Amiodarone interact, and Amiodarone and Oxycodone interact, but Warfarin and Oxycodone are considered safe. My initial assumption was that “if A interacts with B, B interacts with A” but for the purpose of this project that may be too broad for several reasons.
- As mentioned above, some adverse drug-drug interactions only occur in some people based on their gene expression.
- Certain interactions are more severe than others. WebMD’s drug interaction checker uses a range of measurements: “Do not take together, serious, significant, minor” to describe the interactions. But among the three tested, the results were a bit unclear. Warfarin + Amiodarone is considered both serious/significant for basically the same reasons. Amiodarone + Oxycodone is considered significant/minor for basically the same reasons.
- FDAs database seems like it works by querying the information reported by the National Center for Toxicological Research. Each drug has a page, and most have a section on adverse drug-drug interactions. There is an entry for each drug, but each drug may have multiple manufacturers that produce slightly different versions.
- In the database, Warfarin and Amiodarone list each other, Amiodarone lists Oxycodone, Oxycodone does not list Amiodarone. (As a side note, Oxycodone only lists other forms of Oxycodone as causing adverse events). Warfarin lists 6150 connections, Amiodarone lists 1445, and Oxycodone lists 79.
Around 2pm my Chromebook crashed because it was running some pretty memory-intense applications when it only has 2GB available at any time. I tried to work with it for a little longer before returning to work on my desktop at home. A few more hours didn’t seem to produce any more results, and I felt kind of defeated when every solution I tried seemed to blow up and produce more problems. Overall I feel like this has been a solid week, but my direction feels more unclear than I wanted it to.
Week 2 Deliverables
Update on meetings: [above]
Ultimate deliverable: a paper. Sriraam would like the first couple weeks of our research to be somewhat exploratory, what is even possible to accomplish is somewhat of an unknown until we make a little progress. If we work hard there will be something at the end of it.
Related work from Mentor: Four papers: “A Novel Method for Adverse Event Extraction from Text” [2016-under review], “Extracting Adverse Drug Events from Text using Human Advice” [2015], “Inductive Logic Programming: Theory and Methods” [1994], “Inductive Logic Programming” [1991]. In total I have 10 papers in my related work, all of which connect to each other in one way or another. Most of this work is related to detecting adverse events using NLP and ML, so I still need to connect this with work on detecting drug-drug interactions.
Your experiences, what you worked on, what you’re struggling with: [above]
Week 3
Week-at-a-glance (hours include time spent in the office):
| Date | In - Out | Total Hours | Minutes of Wall Sits | Caffeine Drank |
|---|---|---|---|---|
| Monday, 2016-06-06 | 7:50am – 5:36pm | 9hr46min | 0 minutes | 364 mg |
| Tuesday, 2016-06-07 | 7:55am – 5:58pm | 10hr3min | 6 minutes | 182 mg |
| Wednesday, 2016-06-08 | 7:54am – 5:37pm | 9hr43min | 4 minutes | 182 mg |
| Thursday, 2016-06-09 | 9:20am – 8:04pm | 10hr29min | 3 minutes | 72 mg |
| Friday, 2016-06-10 | 8:00am – 6:00pm | 10hr00min | 0min | 455 mg |
Compared to last week (first four days):
~43% reduction of caffeine, ~14% increase in hours worked, +3 minutes of wall-sits
Monday, June 6, 2016
To recap from last Friday: I started working through openFDA’s label database to get an idea of how I might be able to get the data I needed, though I kept running into roadblocks that forced me to rethink my strategy for how to proceed.
I began bright and early Monday morning in a similar spot.
My difficulties with openFDA remained, but I still knew that I needed something
to evaluate it against even if I did get the API working. I got on WebMD’s
drug interaction checker and added 26 of the most commonly prescribed drugs to
the list (it’s probably safe to say that this was not the original intention for
the site’s developers), the tool warned me that the medications I was taking
likely presented 216 interactions.
At 1pm STARAI lab met and Professor Natarajan established that we would meet Mondays and Thursdays at 3pm from now on. The discussion for today: “Open Problems the Group was Solving,” one of which was obviously the adverse drug interactions project Savannah and I have been working on different sides of. His intention was to open the discussion to see where everyone in his lab had their interests at, what papers could likely be published soon, and whether anyone would be more interested on a different project. Towards the end I gave him a quick update on where I was at: successfully pulling PubMed Abstracts but still fighting with openFDA, but hopeful that WebMD could be a workaround.
After the meeting ended I returned to my desk upstairs and promptly discovered that WebMD’s interaction checking tool only allowed 30 inputs. Admitting that I just needed to tackle the problem head-on, I spent the next few hours reading the documentation.
Before I called it a day, I borrowed a marker board from the grad room and outlined my goals for the next two weeks on it (consisting mostly of solving the drug name / drug interactions database problem).
Tuesday, June 7, 2016
Breakthrough. After another hour of reading the documentation I was able to write my own queries that retrieved JSON outputs, and quickly realizing that one solution opens up many new problems. I needed an api key.
But first I’d like to talk about graphs.
I started drawing these last week:
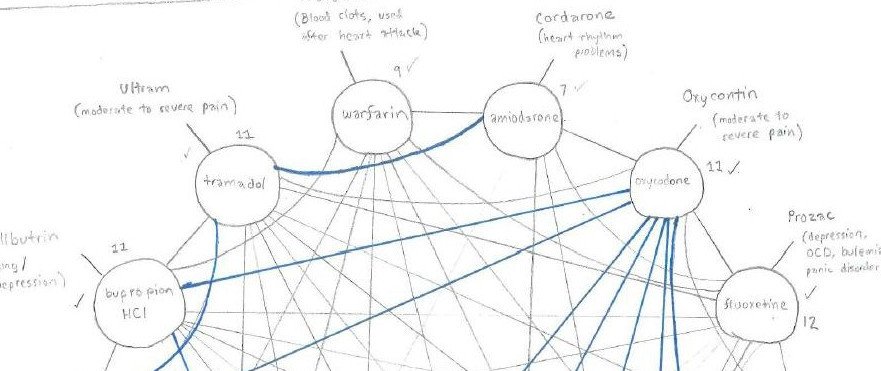
They started out simple enough: noting that warfarin, amiodarone, and oxycodone HCl formed a line. A reacts with B, B reacts with C, but C does not react with A.
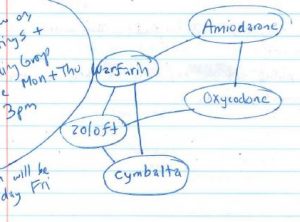
I had a number in my head that around 6150 drugs caused negative effects when taken with warfarin, but to know if I was working in the right direction I needed to know which pairs.
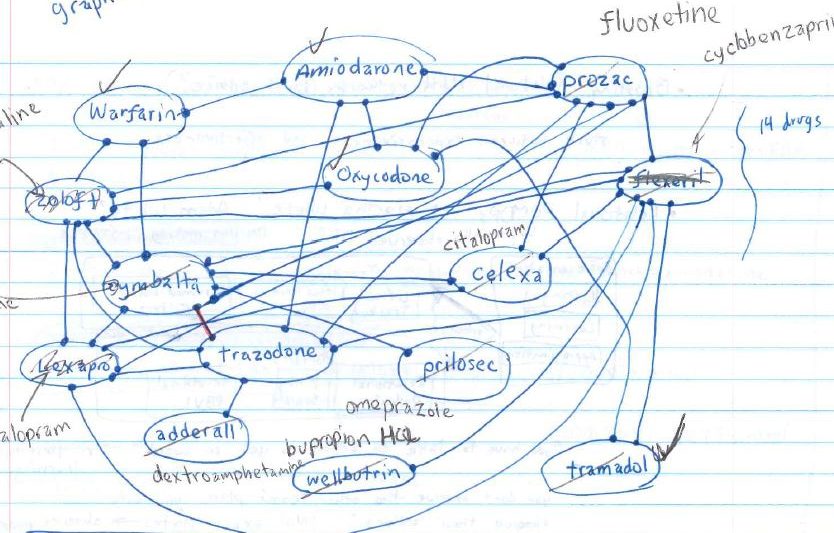
It became obvious that these networks were extremely interconnected, but I still couldn’t tell exactly how close they were. I gave up drawing the one (above) halfway through because of how many lines were needed and how difficult it was becoming to read my own graph.
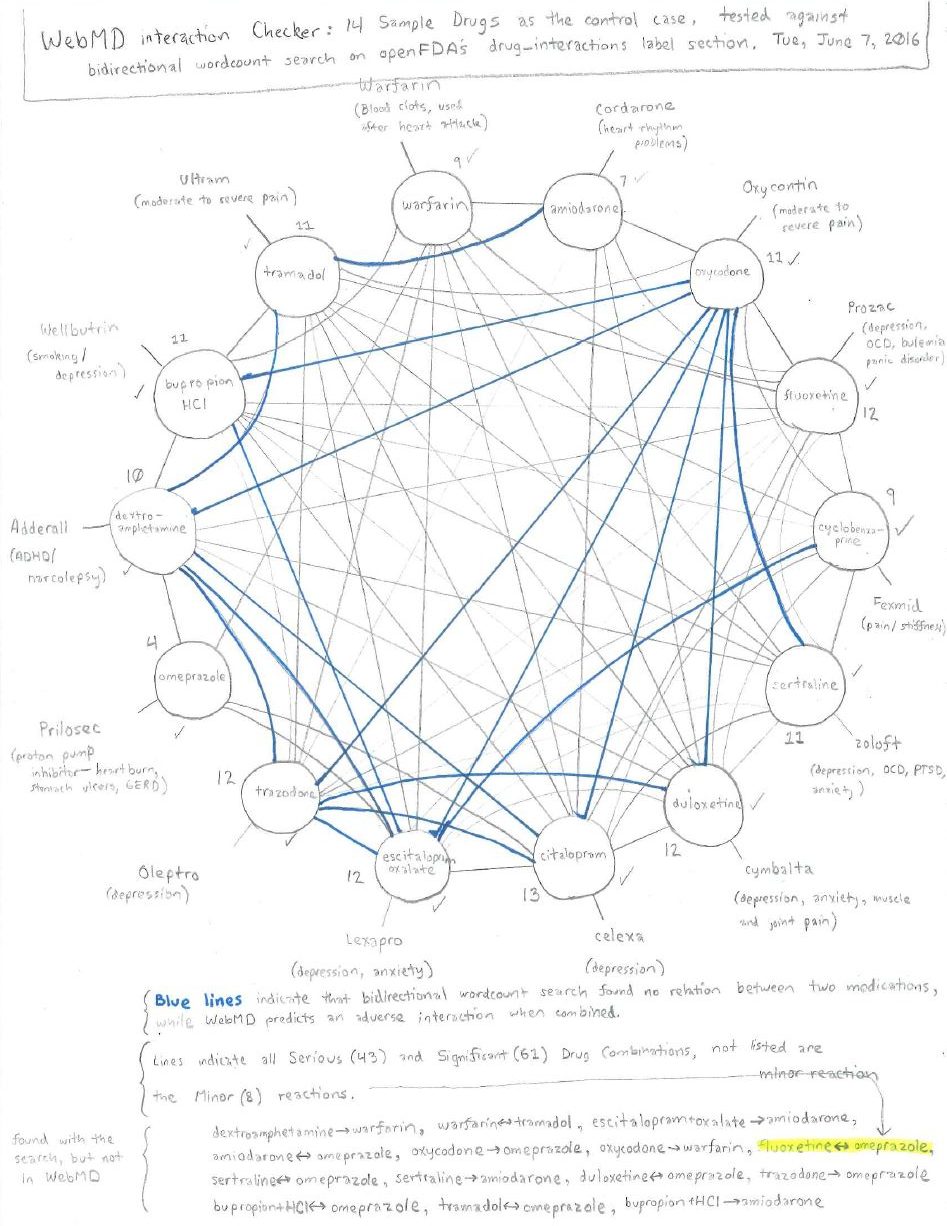
I finally sat down with a ruler, a protractor, WebMD in one tab and openFDA queries in another. There were two main ways I decided I could approach my problem since the API supported creating an output that counted all of the words for me.
API_KEY=
QUE=warfarin
for i in {0..240}; do
  wget –no-check-certificate https://api.fda.gov/drug/label.json?api_key=$API_KEY\&search=adverse_reactions:$QUE+drug_interactions:$QUE+warnings_and_cautions:$QUE\&limit=1\&skip=$i -O $QUE$i
done

QUE=warfarin; wget –no-check-certificate https://api.fda.gov/drug/label.json?api_key=$API_KEY\&search=generic_name:$QUE\&count=drug_interactions\&limit=1000 -O $QUE-interactions
Starting with WebMD’s medical interactions tool as my control, I drew lines where WebMD claimed there was an interaction between two drugs (barring those considered low risk). I then tested WebMD against whether drugs listed one another when I looked them up with openFDA. The pencil lines indicate agreement, the blue lines indicate openFDA did not find the drugs listed under either term, and drugs found with openFDA but not WebMD are at the bottom (fluoxetine with omeprazole notably was considered a low-risk combination by WebMD).
Based on my sample of fourteen drugs, this method looks fairly inaccurate, it’s certainly a naive algorithm behind the scenes. I learned that this is a reasonable shortcut for making a quick guess, but the false-negative and false-positive rates would be far too high for me to be comfortable making health decisions with it. As a side note, this would have removed NLP almost entirely, which isn’t really a goal of the project.
Wednesday, June 8, 2016
After yesterday’s back-to-back breakthroughs, it became fairly clear what my task was. I dove headfirst into Bash. I’d done a lot of command line over the last few years, but scripting was something I’d had little contact with. Between stackoverflow, manual pages, and a few pages of notes I took along the way I had a script I was pretty satisfied with.
https://github.com/hayesall/DrugInteractionDiscovery/blob/master/openFDA/fdainteractions.sh
Here’s how it works:
$ fdainteractions warfarin
Running this command will count the number of drugs with generic_name
warfarin, collect all adverse_reactions, drug_interactions, and
warnings_and_cautions, then output them to a single file that can later be
used for NLP.
Thursday, June 9, 2016
Another day in the wonderful world of scripting. I spent the first part of my
day fixing some lingering issues with the fdainteractions, and did some
tests running the scripts on a dedicated server. One of my main concerns is
with openFDA’s limitations: searches are limited to 240 searches per minute
or 120,000 per day. The 240/minute is about 4pages/second, the download speed
will mostly keep this in check, but fluctuates from 3.6/s to 4.7/s. I may need
to reevaluate this over the next few days, and especially before I finish
the program and let it tick.
I wrote another script builddruglist (that ended up being much prettier than
my first). It took about three hours to get it into a state I was happy with,
but the finished product makes it really easy to pull a set of 4683 drugs
from rxlist.com and format them to make them useful.
https://github.com/hayesall/DrugInteractionDiscovery/blob/master/openFDA/builddruglist.sh
I took this picture of my marker board before I left on Thursday, needless to say I’ve made many new developments over the last few days. I would estimate I am on a great track now to complete ‘get drug names’ before the end of Week 4.
Friday, June 10, 2016
Feeling extremely successful with my previous two scripts I wrote a third to tie them together:
https://github.com/hayesall/DrugInteractionDiscovery/blob/master/openFDA/rxdownloader.sh
It starts by generating a fresh list of all drugs on rxlist.com using
builddruglist.sh. Then it feeds each item in the list into fdainteractions.sh.
On the side it also works somewhat like a sorting algorithm: data is generated
for generic drugs, while brand name and unknown drugs are placed into
BRANDNAMEDRUGS.txt and UNKNOWN.txt. LOG.txt contains a short transcript
of each step rxdownloader performs
(including the time when a drug was downloaded).
It will take quite some time to run (currently estimating ~13 hours at 30 minute per letter), so I’ll run the program over the weekend.
Week 4
Week-at-a-glance (hours include time spent in the office):
| Date | In - Out | Total Hours | Minutes of Wall Sits | Caffeine Drank |
|---|---|---|---|---|
| Monday, 2016-06-13 | 9:44am – 5:40pm | 7hr56min | 0 minutes | 0 mg |
| Tuesday, 2016-06-14 | 8:40am – 8:05pm | 10hr25min (1 hour break) | 3.1 minutes | 0 mg |
| Wednesday, 2016-06-15 | 9:30am – 5:32pm | 8hr2min | 3.1 minutes | 0 mg |
| Thursday, 2016-06-16 | 8:03am – 7:22pm | 11hr19min | 3.1 minutes | 91 mg |
| Friday, 2016-06-17 | 7:38am – 8:03pm | 12hr25min | 4.1 minutes | 91 mg |
Monday, June 13, 2016
(Recap from Friday: I wrote rxdownloader.sh to pull information from openFDA)
Running rxdownloader over the weekend proved to be much less successful than
I hoped, there was one case I hadn’t considered: the program crashing. Since
it started by downloading a fresh copy and running until it ran out of drugs
there was no way to fix it if it crashed. After checking the log files,
it appeared that it simply stopped executing the program after 32 minutes
50 seconds.
I began Monday morning at 9:44am and rewrote rxdownloader.
Changelog:
builddruglist.sh- Removed the title information “RXDownloader written by…,” moving it into
a function of
rxdownloader.sh(refer totitlescreenfunction).
- Removed the title information “RXDownloader written by…,” moving it into
a function of
fdainteractions.sh- fixed an issue that prevented the 240searches/minute limit from working
properly:
[$SPEED -gt 4 ]–>[$SPEED -ge 4]
- fixed an issue that prevented the 240searches/minute limit from working
properly:
rxdownloader.sh- Separated
runthetestfunction into two functions:freshandpulldata. rxdownloadernow requiresfreshto be passed to it in order to delete data and download a new copy ofdrugslist.txtrxdownloadernow uses a while loop to pass names fromdrugslist.txtintofdainteractions.shbefore deleting a line. This makes it easier to restart the program when it crashes.titlescreenfunction moved frombuilddruglist.sh
- Separated
I finished downloading around 74% of the data by the time I left, and figured I could download the rest when I got home.
Tuesday, June 14, 2016
The script finished running last night, but the log file only had information on 4107 of the 4684 I expected it to contain. I pulled a fresh copy of the drug list with builddruglist.sh and compared the statistics with my earlier notes, only to find something surprising:
Thursday, 6/9/16 | 5131 drugs/ 8 seconds | Total: 5980 | 849 unsafe characters removed | 448 duplicates removed | 4683 on the list after the removals

Tuesday, 6/14/16 | 5141 drugs/ 5 seconds | Total 5994 | 853 unsafe characters removed | 450 duplicates removed | 4691 on the list after the removals
The list is dynamic, more drugs are added everyday. But that still doesn’t explain why I’m short close to 577 drugs. I also combed back through builddruglist.sh after finding it odd that all the drugs starting with ‘S’ were missing. I realized I was passing my final list into uniq -u, effectively removing ALL duplicates rather than just the second copy. I updated builddruglist.sh and wrote fixlist.sh, which downloads a fresh copy of drugslist.txt, checks each entry against rxdownloader’s LOG, then creates a list of drugs missing from the LOG.
756 drugs were added and I ran rxdownloader again.
Wednesday, June 15, 2016
We had a great morning, starting off by playing Ultimate Frisbee with a combined total of 13 people from ProHealth and Security split between two teams. We tried keeping score at first but tracking after about 20 minutes. Around 10:00am the dark clouds rolled in from the west and a breeze cooled us down, but soon enough warm rain pelted us as we played. The disc was hard to catch when it was covered in water and rocked by the wind, and all of us were exhausted from running but couldn’t distinguish sweat from the rain. We played through the rain and couldn’t breathe by the end, but everyone there couldn’t wait for next week.
I hit a huge wall. For the last week I wrote of pulling the abstracts as a fairly trivial step that wouldn’t take long after I got a list of drugs, since I could:
$ pmsearch -t 800 -d 50 warfarin amiodarone | pmid2text -a -i
The previous command pulls the top 50 PubMed Abstracts from the last two years for keywords “warfarin” and “amiodarone.” Writing a script that does this is easy, but I didn’t consider that it is still an \(n^{2}\) problem.
Conceptually this problem is similar to a matrix with 4881 drugs on the x-axis and 4881 drugs on the y-axis. In total there are 23,824,161 ways to combine these drugs, so running it on my laptop (somewhere between 2-3 searches per second) will take ~110.29 days.
I spent most of my day doing whiteboard math. I was pretty sure I could split the matrix in half somewhere, but even if I could it would still be ~55 days to process the entire thing.
Professor Siek and Ben had presentations on Abstracts and Peer Review, respectfully. I left at 5:32pm for GRE prep, but felt a bit defeated.
Thursday, June 16, 2016
After thinking about the problem all last night, I came in bright and early and
wrote the framework for pullabstracts.sh with the realization that it was
every bit as inefficient as I predicted. Every new column had the cost of the
previous column + 1, meaning the cost grew extremely quickly.
I asked if anyone was really good with data structures, and Devon Mensching really came through. “Parallel Programming,” she said. She agreed that optimizing out of \((n^2)/2\) was going to be impossible, so my only real option would be to spread it out over a huge number of threads (refer to ‘thread class’ in C++ or Java).
A fairly high-level language probably isn’t an option since I’m heavily bottlenecked by scripts and the download speed between myself and PubMed’s servers, but I did have another option: Odin.4
Since the columns in the matrix are extremely unbalanced I would need to split
the druglist into 100-128 roughly equal parts so one node isn’t doing the bulk
of the work. I wrote smartsplit.sh
for a few purposes: it can approximate the
total runtime of the script, it can be tweaked to account for different
factors, and with a few modifications it can actually split drugslist.txt
into equal parts based on how many nodes I can allocate on Odin.
I was exhausted and extremely hungry when I left at 7:18pm, but I like I cleared a massive hurdle that I hadn’t seen coming.
Friday, June 17, 2016
I got in around 7:38am to wrap up a few things before the 10am deadlines, missing on the peer review. At 10:00am ProHealth had our weekly meeting to touch base and find out where everyone else was in their respective projects.
At 11:30am: Ciabhan, Savannah, Devendra, and I met with Professor Natarajan to discuss where our adverse drug events project. Since the openFDA data was finished being extracted we could begin mining it for useful information. Professor outlined roughly how to create relations that could later be extrapolated in the NLP step, predicting that the labeling step would take about two weeks. Ciabhan would start the process while Savannah and I wrapped up the rest of the information extraction.
I spent most of the afternoon running tests with smartsplit to find the
optimal way to divide the data. I reworked part of it so it would be less
greedy: instead of immediately taking the next ~119096 points immediately it
now compares a few to find the set closest to that number.
I ran into a problem when I actually tested some commands out on Odin. I was
hoping I could just allocate all 128 nodes at once, but it wouldn’t allow me to
use more than 71. I reran some tests with smartsplit, but because I cannot
guarantee that all nodes will be available, I’ll need to write some scripts to
match data with specific nodes.
Odin does some of this work for me with $ srun -N (#).sh, but not to the
level I’ll need it done.
Writing this probably won’t be as straightforward as I hoped. After running some test commands I’m having trouble with all the nodes properly returning what they’re supposed to: random nodes seem to occasionally stop calculating altogether. I’ll continue to investigate this over the weekend, and in full force on Monday.
Week 5
Week-at-a-glance (hours include time spent in the office):
| Date | In - Out | Total Hours | Minutes of Wall Sits | Caffeine Drank |
|---|---|---|---|---|
| Monday, 2016-06-20 | * | 4hr19min | 4 minutes 27 seconds | 0 mg |
| Tuesday, 2016-06-21 | ** | 4hr55min | 0 minutes | 0 mg |
| Wednesday, 2016-06-22 | *** | 5hr21min | 3 minutes | 91 mg |
| Thursday, 2016-06-23 | 9:48am – 11:48pm | 14hr00min | 3.1 minutes | 0 mg |
| Friday, 2016-06-24 | 7:12am – 6:37pm | 11hr25min | 5 minutes | 364 mg |
Totals: 40 hours, 15min45sec wall-sits, 455 mg caffeine
* = 6:44am–8:50am, 11:55am–12:55pm, 4:26pm–5:45pm
** = 7:50am–8:50am, 11:57am–12:57pm, 2:47pm–4:15pm, 7:00pm–8:27pm
*** = 2:05pm–4:35pm, 9:15pm–12:03pm
Sunday, June 19, 2016 (not part of the REU, but part of my week)
SOIC Summer Camp 2016 kicked off with a counselor meeting at 11:00am in Foster Harper. I attended as a camper the summer after my sophomore year of high school, then I became involved as a nighttime counselor the last two summers.
This is the first year I’m working as a day counselor: leading sessions rather than assisting with them. 82 campers showed up between 2:00pm and 4:00pm, among them were some familiar faces from previous years. Matt Hottell kicked off the week by introducing what computer science and informatics were, then went into what we would be doing over the next few days.
From then until 9:00pm the campers had dinner and did activities like video games, board games, football, or movies. The counselors mediated and got to know people through these activities.
Monday, June 20, 2016
I started my day at 6:44am, putting the finishing touches on the peer reviews
before they would be sent out later today. I returned my attention to
scheduleODIN.sh, which still had the issue with determining order. The
hostname of each node seemed like the only piece of information available to
distinguish one node from another, but I needed to transform numbers from
4-128 into 1-71 without repeating or missing.
At 8:50am SOIC camp announcements began, and I set up for my track on basic programming with scratch (meanwhile the rest of ProHealth were teaching circuits). There was only a little over an hour for the session, so I used Scratch to teach some of the concepts without having to spend a huge amount of time discussing syntax.
Two sessions of ~40 students lasted until their lunch break at 11:45. During
this time I returned to my desk and the problem at hand. I made small tweaks at
first in hope of catching something, but soon decided I needed a less
computationally expensive way to determine the order. The original way used a
combination of grep and sort to assign each node to a section of data, but 71
nodes operating on the same file seemed to be causing some problems. I used
the hostnumber (i.e. odin004.cs.indiana.edu –> 4) as a time delay, added
the hostname to a file, used the position in the file
(wordcount -l) to assign a number (1-71), and printed the results to ensure
accuracy. This time there were no empty nodes.5
The afternoon tracks began at 1:15pm, and I taught webpage design with html and some basic css. I didn’t have as much material prepared for this one, and ran out of stuff to teach after about 1.5 hours of a 3 hour session. By then many were working in their own direction anyway, some were embedding videos, others figured out how to add music, most pages were pretty interesting (and full of memes) by 4:15.
While the campers ate dinner I ran a few more tests with scheduleODIN, and
began planning how to combine it into my existing method for pulling abstracts
in sequence.
The campers returned from dinner around 6:00pm, and I spent most of the evening helping with the Vive virtual reality demos. I got home a little before 10:00pm, ate spaghetti and fell asleep.
Tuesday, June 21, 2016
I got to the Informatics building at 7:50am and spent an hour working where I left off. From 9am until 11:45am I led two groups of campers in geocaching while also answering their questions about the school, IU in general, or what kind of stuff I work with. The first group started on a multi-cache up by the stadium, but the followup coordinates pointed to the law school, so we wouldn’t have time to make it that far. The second group started their quest over by the music school, and found two caches and the clues to a third before we returned.
While the campers were eating lunch I started rewriting portions of
pullabstractsODIN.sh.
It started fairly similar to the sequential
pullabstracts
script, but making sure all of the changes would still work
properly when 71 copies were running simultaneously was difficult to think about.
After lunch Christian Achgill and I took about 14 campers to the art museum to practice photogrammetry and 3D modeling. Each camper took about 75 photos of a 3D piece artwork, went to a lab, used computer vision software to turn the images into a model, then cleaned up the model and added color.
The software was sophisticated but fairly intuitive to use after some basic instruction, so the campers were able to work mostly on their own. During this time I continued on the script, and almost all of it was written by the time we needed to leave at 4:15pm.
I ate dinner with the campers and took them to the bowling alley at the Union. Some of the campers wanted to go to the computer lab, so I planted myself in the corner to chaperone and put the finishing touches on the script. When it was complete I pushed the copy to GitHub and emailed Devendra an update on my progress.
That night I worked on my slides and practiced for tomorrow morning, I slept for four hours.
Wednesday, June 22, 2016
Wednesday is the last day of instruction at the SOIC Summer Camp, and only consists of one session in the morning: a 2.75-hour “ending keynote” that combines everything the campers have learned. In previous years Nina Onesti has discussed HCI, the dean has discussed artificial intelligence and his vision of the future of computing. This year, Matt asked Josh and I to discuss our work and tie everything back to data.
I split the time into three sessions: computer science, informatics, and Josh’s discussion for the last 45 minutes.
For the computer science section; I talked to the campers about what data is, the difference between data and information, how we transform one into the other, and what data is used for. I showed them examples of how data is used in artificial intelligence for making predictions in fields as varied as economics, political science, music, and health. I wrapped up the section by demonstrating the scripts and data I’ve generated for the ProHealth REU, and explained how we hope to use what we learn to empower patients and doctors to make safer health choices.
I started the informatics section with two questions: “How much would you pay to use Facebook” and “How much would you pay to use Google?” I staged this part of the talk as a discussion, and opened the floor to what they thought, before transitioning into what they already pay to use these “free” services. Instead of data about things out in the world, we talked about people as data: advertising profiles created by companies like Facebook and Google to track and target them. I let them choose where to direct addons (Light Beam, Keywords Everywhere) to reveal how deep the advertising rabbithole goes. Finally, we wrapped the section up with an activity where the campers looked at their phone permissions and noted which ones may be dangerous or invasive.
For the final 45 minutes, Josh presented his research so far on how apps leak personal information. He showed them the charts from Dr. Latanya Sweeney’s research into this topic, discussed how apps can often gleam information from other apps, and how some apps require more permissions than should otherwise be necessary in order to contribute to consumer profiles. He then wrapped up with a Q&A on his research and general security practices.
I ate lunch with the campers and we split them into groups for afternoon activities around Bloomington. I returned to Informatics for the Wednesday discussion on networking at academic conferences, then returned to help campers debug C# in Unity.
At 5:00pm we regrouped and split into groups for dinner, I took a group of ten to Wright Cafeteria, others went to Mother Bears, BuffaLouie’s, and Noodles&Co. We returned to Informatics around 6pm for 3D printing, evening activities, and ice cream.
I got home at a little before 10pm, then worked for a few hours to put some finishing touches and tests into my script. I was so tired that I don’t remember falling asleep, but my last save was pushed at 11:48pm.
Thursday, June 23, 2016
I don’t remember when I fell asleep, but woke up in bed and fully dressed to my alarm going off at 7am. Thursday only consisted of a counselor panel before the parents picked the campers up, so I started my script at 9:48am, stopping occasionally to make adjustments. After debriefing, I returned to the Informatics building for the STARAI reading group meeting.
At this point I feel like I’m doing quite a bit of waiting for the script to execute, but I’m filling the time by catching up on deliverables and trying to predict how much data we’re going to end up with.
On average, 440 files were being discovered per minute, and each file consisted
of 1-20 medical abstracts about a drug-drug pair
(i.e. Warfarin-Amiodarone.txt). Judging time was tricky since I hadn’t been
keeping track very well, but after some estimates I predicted about 1/5 of the
data was complete (based on what I knew about how many searches needed to be
done and how many I had completed so far). At this time there were 131,402
files that represented medical abstracts containing information about two drugs.
If the last 4/5 of the data were similar to the first 1/5, approximately
657,010 files would be written to when the script was complete.
I met with Sriraam and Devendra around 6pm to discuss my thoughts and ask for some guidance. Sriraam was concerned with scale, thinking that so many files would take too much time to build a model around, he recommended focusing on interactions from FDA alerts since they may not be in the openFDA data set yet. Devendra agreed, but wanted me to continue running the script so we could at least see the data before deciding whether or not to use it, we could at least start with a subsection of the data and expand as much as possible.
Sriraam ordered Thai food for the lab members who were still around at 7:30pm, and we met with his guest to discuss our work. I spent the next few hours investigating the rate at which nodes stopped running. I hated babysitting my code while it ran, but a single node crashing could represent hours of lost time.
One thing I found extremely strange was that nodes seemed to be running the
script at different rates. I modified scheduleODIN to take progress samples
from each node every four seconds, finding that some nodes were checking 1
drug/second while other nodes were checking 3 drugs/second, some nodes stopped
running the script entirely only to start again 10 minutes later.
Friday, June 24, 2016
I got into the office at 7:12am, soon finding that all of the nodes halted calculation around 2:00am. This was upsetting, I hoped I would wake up to find the script complete.
I re-allocated my nodes and let the script run while I was at my meetings. At 10am ProHealth had their weekly meeting the recap on the week. At 11:45 I met with Dr. Connelly, Devon, Aislinn, and Majdah to discuss the new-mothers app they were working on–now that the initial coding was complete they needed a logo and some icons.
Around noon the script was hovering around 74%, so I read for a while.
At 3pm ProHealth Tea involved some discussion on networking and privilege. Then we had cake and muffins while we did a few activities.
Around 5pm most of the activities were wrapping up, and my script was around 88% complete, I worked on the designs for Devon and Aislinn and made some updates to my deliverables until I left at 6:37pm, extremely content that I survived this week.
Week 6
Week-at-a-glance (hours include time spent in the office):
| Date | In - Out | Total Hours | Minutes of Wall Sits | Caffeine Drank |
|---|---|---|---|---|
| Monday, 2016-06-27 | 8:16am – 5:43pm | 9hr27min | 3 minutes | Starbucks Americano: 150 mg |
| Tuesday, 2016-06-28 | 8:53am – 6:15pm | 9hr22min | 0 minutes | 0 mg |
| Wednesday, 2016-06-29 | * | 10hr47min | 0 minutes | 91 mg |
| Thursday, 2016-06-30 | 10:01am – 8:54pm | 10hr53min | 6 minutes | 182 mg |
| Friday, 2016-07-01 | 9:18am – 2:34pm | 5hr16min | 5 minutes | 273 mg |
* – 8:35am – 5:40pm, 7:48pm – 9:30pm
Totals: 45hr45min, 14minutes wall-sits, 696mg caffeine
- I took things a little slower this week to recover from my previous one.
- My website is available at http://batflyer.net
- There are 10 images in my 9 previous posts. This post contains 9 images.
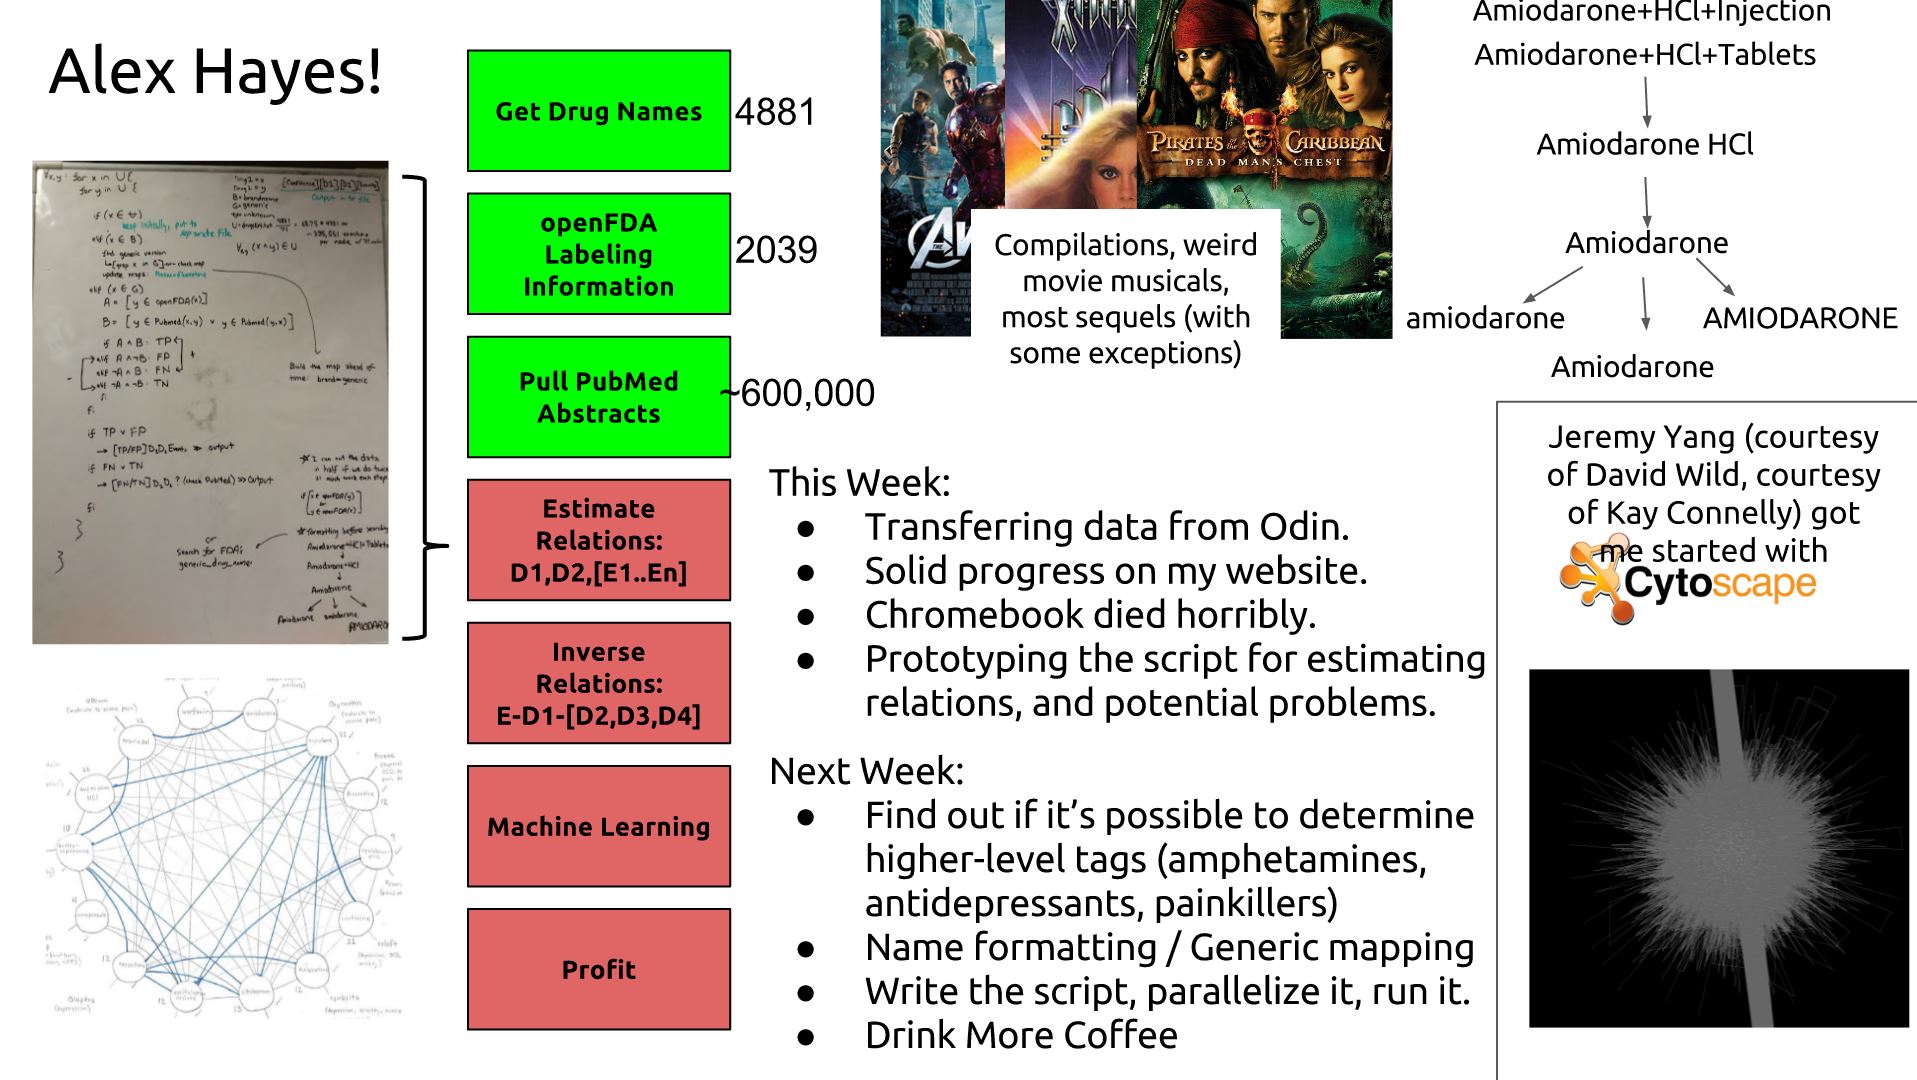
Monday, June 27, 2016
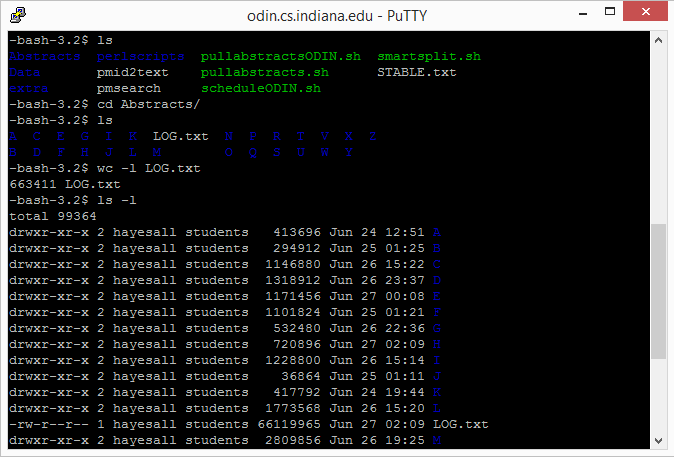
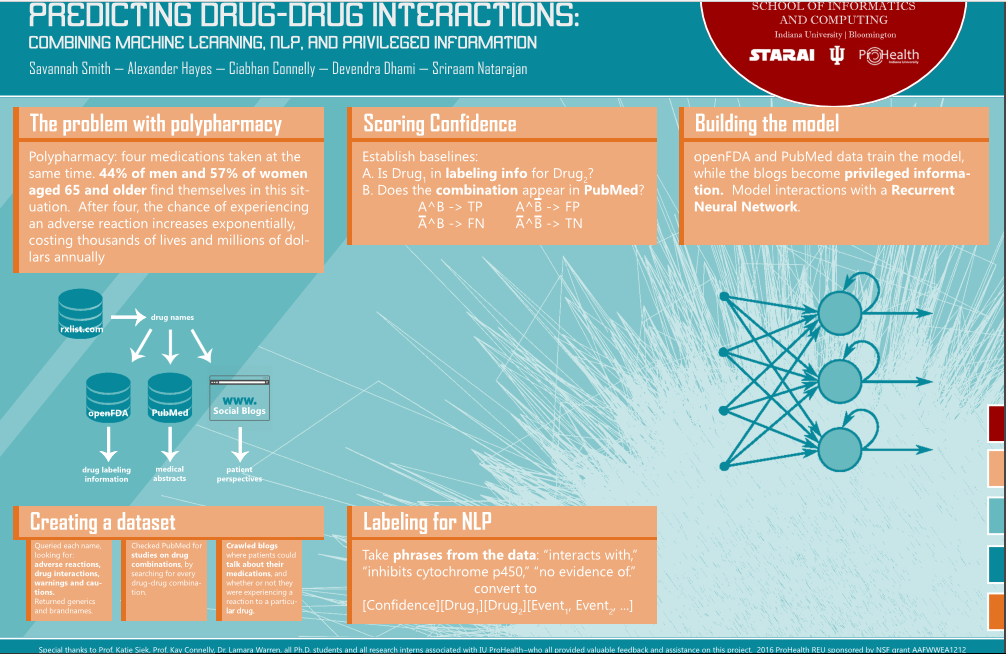
The script finished executing over the weekend, resulting in around 663,411 files (number is based on entries in the LOG file, exact total is unconfirmed at the moment). This amounts to 5.4 GB of PubMed abstracts. It took around 7 hours to download the data from Odin, and another 45 minutes to get it on the hard drive.
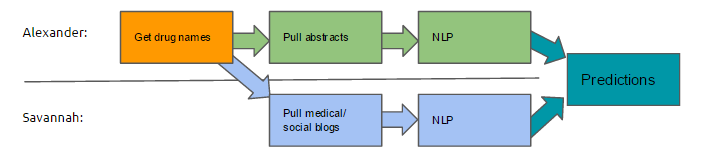
I was a bit at a loss for what to do at this point, the task list we established during week 2 basically ended here for me. Ciabhan was labeling, Savannah was pulling blog data, and Devendra would be analyzing the abstracts to determine what was usable (or if there were too many).
To keep busy I focused on some of the deliverables, specifically my website: batflyer.net
I used Twitter’s bootstrap as a starting point for its excellent focus on webpages that transition effectively between desktop and mobile. Then for the most part I focused on my homepage, planning for a consistent theme throughout the site.
Typically we have our weekly lab meetings on Monday, but Sriraam forewent it in favor of taking us out to Starbucks–three of his papers were accepted and he wanted to celebrate. The weather and the walk were each nice. I ordered a tall Americano.
Tuesday, June 28, 2016
I gave Devendra the hard drive with the PubMed data on it. I spent some more time working on my homepage, focusing more on the background. Yesterday I used a stock photo but wanted something more dynamic based on how the rest of the page was working (simply covering the background with a stretched image looked messy).
Low-poly designs always appealed to me, and I found a project by Samuel Marchal (Twitter, GitHub, codepen) for creating moving backgrounds with CSS and JavaScript. After quite a bit of tweaking I got something I was extremely satisfied with.
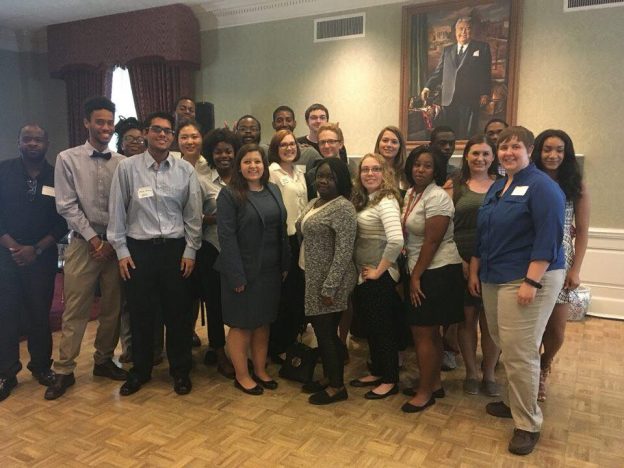
Later in the day ProHealth and SROC met in the University Club Presidents room for the SUR/REU reception, where we had food and enjoyed a short presentation and discussion by SOIC interim dean Dr. Brad Wheeler.
Ayush (ProHealth Blog, Ayush Kohli’s GitHub) and I returned to the Informatics building around 4pm. After working for half an hour my Chromebook crashed, something similar happened during Week 1, but it would take some time to fix. To keep occupied I pushed my schedule ahead a little bit, and went downstairs to meet with Devendra. He proposed that we use the data from openFDA to evaluate how likely the drug combinations from PubMed were.
This approach was similar to the method for comparing openFDA’s data to WebMD’s drug interaction checker that I used for forming the graph pictured below. Previously, WebMD was the control that openFDA was checked against; now openFDA is the control that PubMed will be compared against. I need to write a script to do this automatically. The final output will be a text file listing:
[Confidence as TP/FP/FN/TN] [Drug1] [Drug2] [Adverse Event from openFDA]
Wednesday, June 29, 2016
I spent a couple hours trying to resurrect my Chromebook but became increasingly frustrated with my inability to do so. Nothing was lost because everything was either backed up or on one of IU’s Linux workstations, but not having my normal resources would throw a wrench into my productivity.
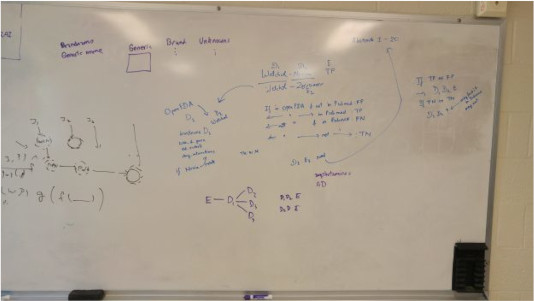
Most of my day was spent whiteboarding the script Devendra proposed yesterday, while also trying to predict the primary challenges.
Our 2pm Wednesday session was lead by Dr. Connelly and Majdah, discussing lightning talks and posters, respectfully. While drafting my poster I talked to Dr. Connelly about data visualization, and she sent an introductory email on my behalf to Dr. David Wild (David Wild Website), inquiring about software for displaying potential drug interactions as a network.
After the session I wrapped up my whiteboard draft and reviewed the algorithm with Devendra. Similar to the script for pulling PubMed abstracts, this would likely need to check every combination of drugs (around 23 million), however it could also be cut in half (around 11.5 million) using a similar technique to pullabstractsODIN.sh.
I had GRE prep from 6:00pm-7:30pm, but followed up with Dr. Wild and his PhD student Jeremy Yang on visualization. Jeremy directed me toward a tool called Cytoscape. I was able to get some results, but I have a lot to learn before I can make something that looks decent. I used the data from the Abstracts LOG to construct a network, giving me the first real glimpse into what the graph may look like.


Thursday, June 30, 2016
I started my day by updating my slide for our ProHealth Meeting tomorrow, then made some blog updates.
Following yesterday’s discussion on introductions and lightning talks, I watched quite a few prescription drug commercials for inspiration. Along the way I discovered a lot of video blogs belonging to people taking these medications. I mentioned this to Savannah as another potential source of consumer information, but both of us were skeptical on whether it could be scaled (for example: Google’s automatic captions could likely be downloaded with a script, but the text-to-speech accuracy is extremely unreliable).
My laptop was having a lot of issues so I worked on my blog at the computer on Aislinn’s desk while she was out of the office.
Ben, Sam, Olivia, and I had a fantastic 3@3 session: doing two 3-minute wall-sits with a 30-second break in between.
STARAI met a little before 4pm for reading group, tackling: ‘Exploiting Causal Independence in Markov Logic Networks: Combining Undirected and Directed Models.’ Sriraam had to leave a little earlier than normal, but we got through everything but the conclusion.
Annoyed with my Windows laptop, I worked a bit more on the artwork for Devon and Aislinn’s app before working from home for the rest of my day. I finished updating and posting my blog, rendered more images of the network with Cytoscape, and changed a few things on my slide for the ProHealth meeting tomorrow.
Friday, July 1, 2016
I presented my progress at the 10am ProHealth meeting. Then Professor Connelly, Majdah, Devon, Aislinn, and I met to further discuss the app artwork. We set a goal to have the designs finished by next Friday.
I did a bit more white-board coding then left early, heading home for the long weekend to see friends and family.
Week 7
Week-at-a-glance (hours include time spent in the office):
| Date | In - Out | Total Hours | Minutes of Wall Sits | Caffeine Drank |
|---|---|---|---|---|
| Tuesday, 2016-07-05 | 8:58am – 6:07pm | 9hr9min | 0 minutes | 273 mg |
| Wednesday, 2016-07-06 | 9:12am – 5:52pm | 8hr40min | 0 minutes | 91 mg |
| Thursday, 2016-07-07 | 7:18am – 6:50pm | 11hr32min | 3 minutes | 182 mg |
| Friday, 2016-07-08 | 8:00am – 5:45pm | 9hr45min | 3 minutes | 273 mg |
Totals: 39hr6min, 6 minutes (wall-sits), 819 mg caffeine
Tuesday, July 5, 2016
Over the weekend I saw no further success in trying to resurrect my Chromebook, I’ll call Asus and see what they suggest.
Attempting to compensate, I spent a laughable amount of time trying to get Fedora installed on my old laptop. After tweaking fastboot settings, disabling a horrendous number of security features, and standing on one leg while facing the setting sun and sacrificing half my hard disk partition to Richard Stallman I was nowhere closer.
Even when I successfully got USB drive to boot into the operating system the hard drives couldn’t be recognized. I used UNetBootin, Win32DiskImager, Rufus, and every other tool I could find but still couldn’t get any closer.
Sriraam hosted a talk in the STARAI lab at 5pm on aggregators, combining rules, and applications to SRL.
I’d heard before that Windows laptops didn’t play nice with other operating systems, but never imagined this. I went home feeling frustrated and feeling like I had wasted an entire day.
Wednesday, July 6, 2016
After a good night sleep I returned to my laptop with fresh eyes, but chose to work from home on account of the terrible storm.
I tried a few more options since I had my desktop available, made several
bootable usb devices with Ubuntu, Fedora, and Mint. I tried installing each,
but couldn’t get any of the installers to recognize the hard drive, even
though fdrive -l listed every partition. At this point I tried installing
on something other than the internal hard drive, and tried using several thumb
drives and external hard drives I had laying around. Each failed in sequence
with each operating system.
It was getting close to noon, and I couldn’t tell whether this was actually impossible or I was simply inept. I’d wasted enough time already: even though my workflow was thrown off without my normal setup I would just needed to adjust. I started downloading Windows 10 and made my way to the Informatics Building for the 2pm session on applying to Graduate School.
A little over an hour passed while I looked over my previous scripts and evaluated whether I could adapt anything for the one I was about to write.
At 5pm Navdeep gave a talk about ‘Turvo Price Prediction’ while the other lab members critiqued her presentation and slides. She would be presenting the same talk in a few weeks and the feedback was helpful.6
I left at 5:52pm to run over to the Student Building for GRE prep.
Thursday, July 7, 2016
Finally a day where I felt productive. I started bright and early with some video editing, prepping for my lightning talk on Friday. Even though I was happy with the end result, I still consider this a work-in-progress, hopefully I’ll get feedback on how my audience receives the video tomorrow.
“Tell Your Doctor About All Your Medications,” by Alexander L. Hayes
The story I tell begins with commercials that everyone is familiar with, thereby connecting my research to a larger cultural phenomenon. In its current state, I feel like the video effectively captures the repetitiveness of these commercials and the difficulty for an average person to feel confident in making their own health decisions. However, the weight is heavily skewed toward making fun of these commercials, while considerably less time (19 seconds) is actually spent focusing on the adverse health effects these medications present. As another note, no time is allotted for drug-drug interactions, even though some are mentioned in the commercials. The strongest point is probably ending with “Tell your doctor about all your medications,” to echo the title.
If/when the next draft is created, I hope it will be at least 20 seconds longer and can address a few of these issues, especially the lack of named drug-drug interactions (MAOIs, aspirin, nitrates being three fairly common examples).
I pushed my slides for the lightning talk to the Google Drive and headed to
Informatics around noon to pick up where I left off. The core of
pullabstractsODIN
could be adapted for the tuning function since they both evaluated drug
combinations, but instead of pulling abstracts I could splice in the algorithm
I’m writing.
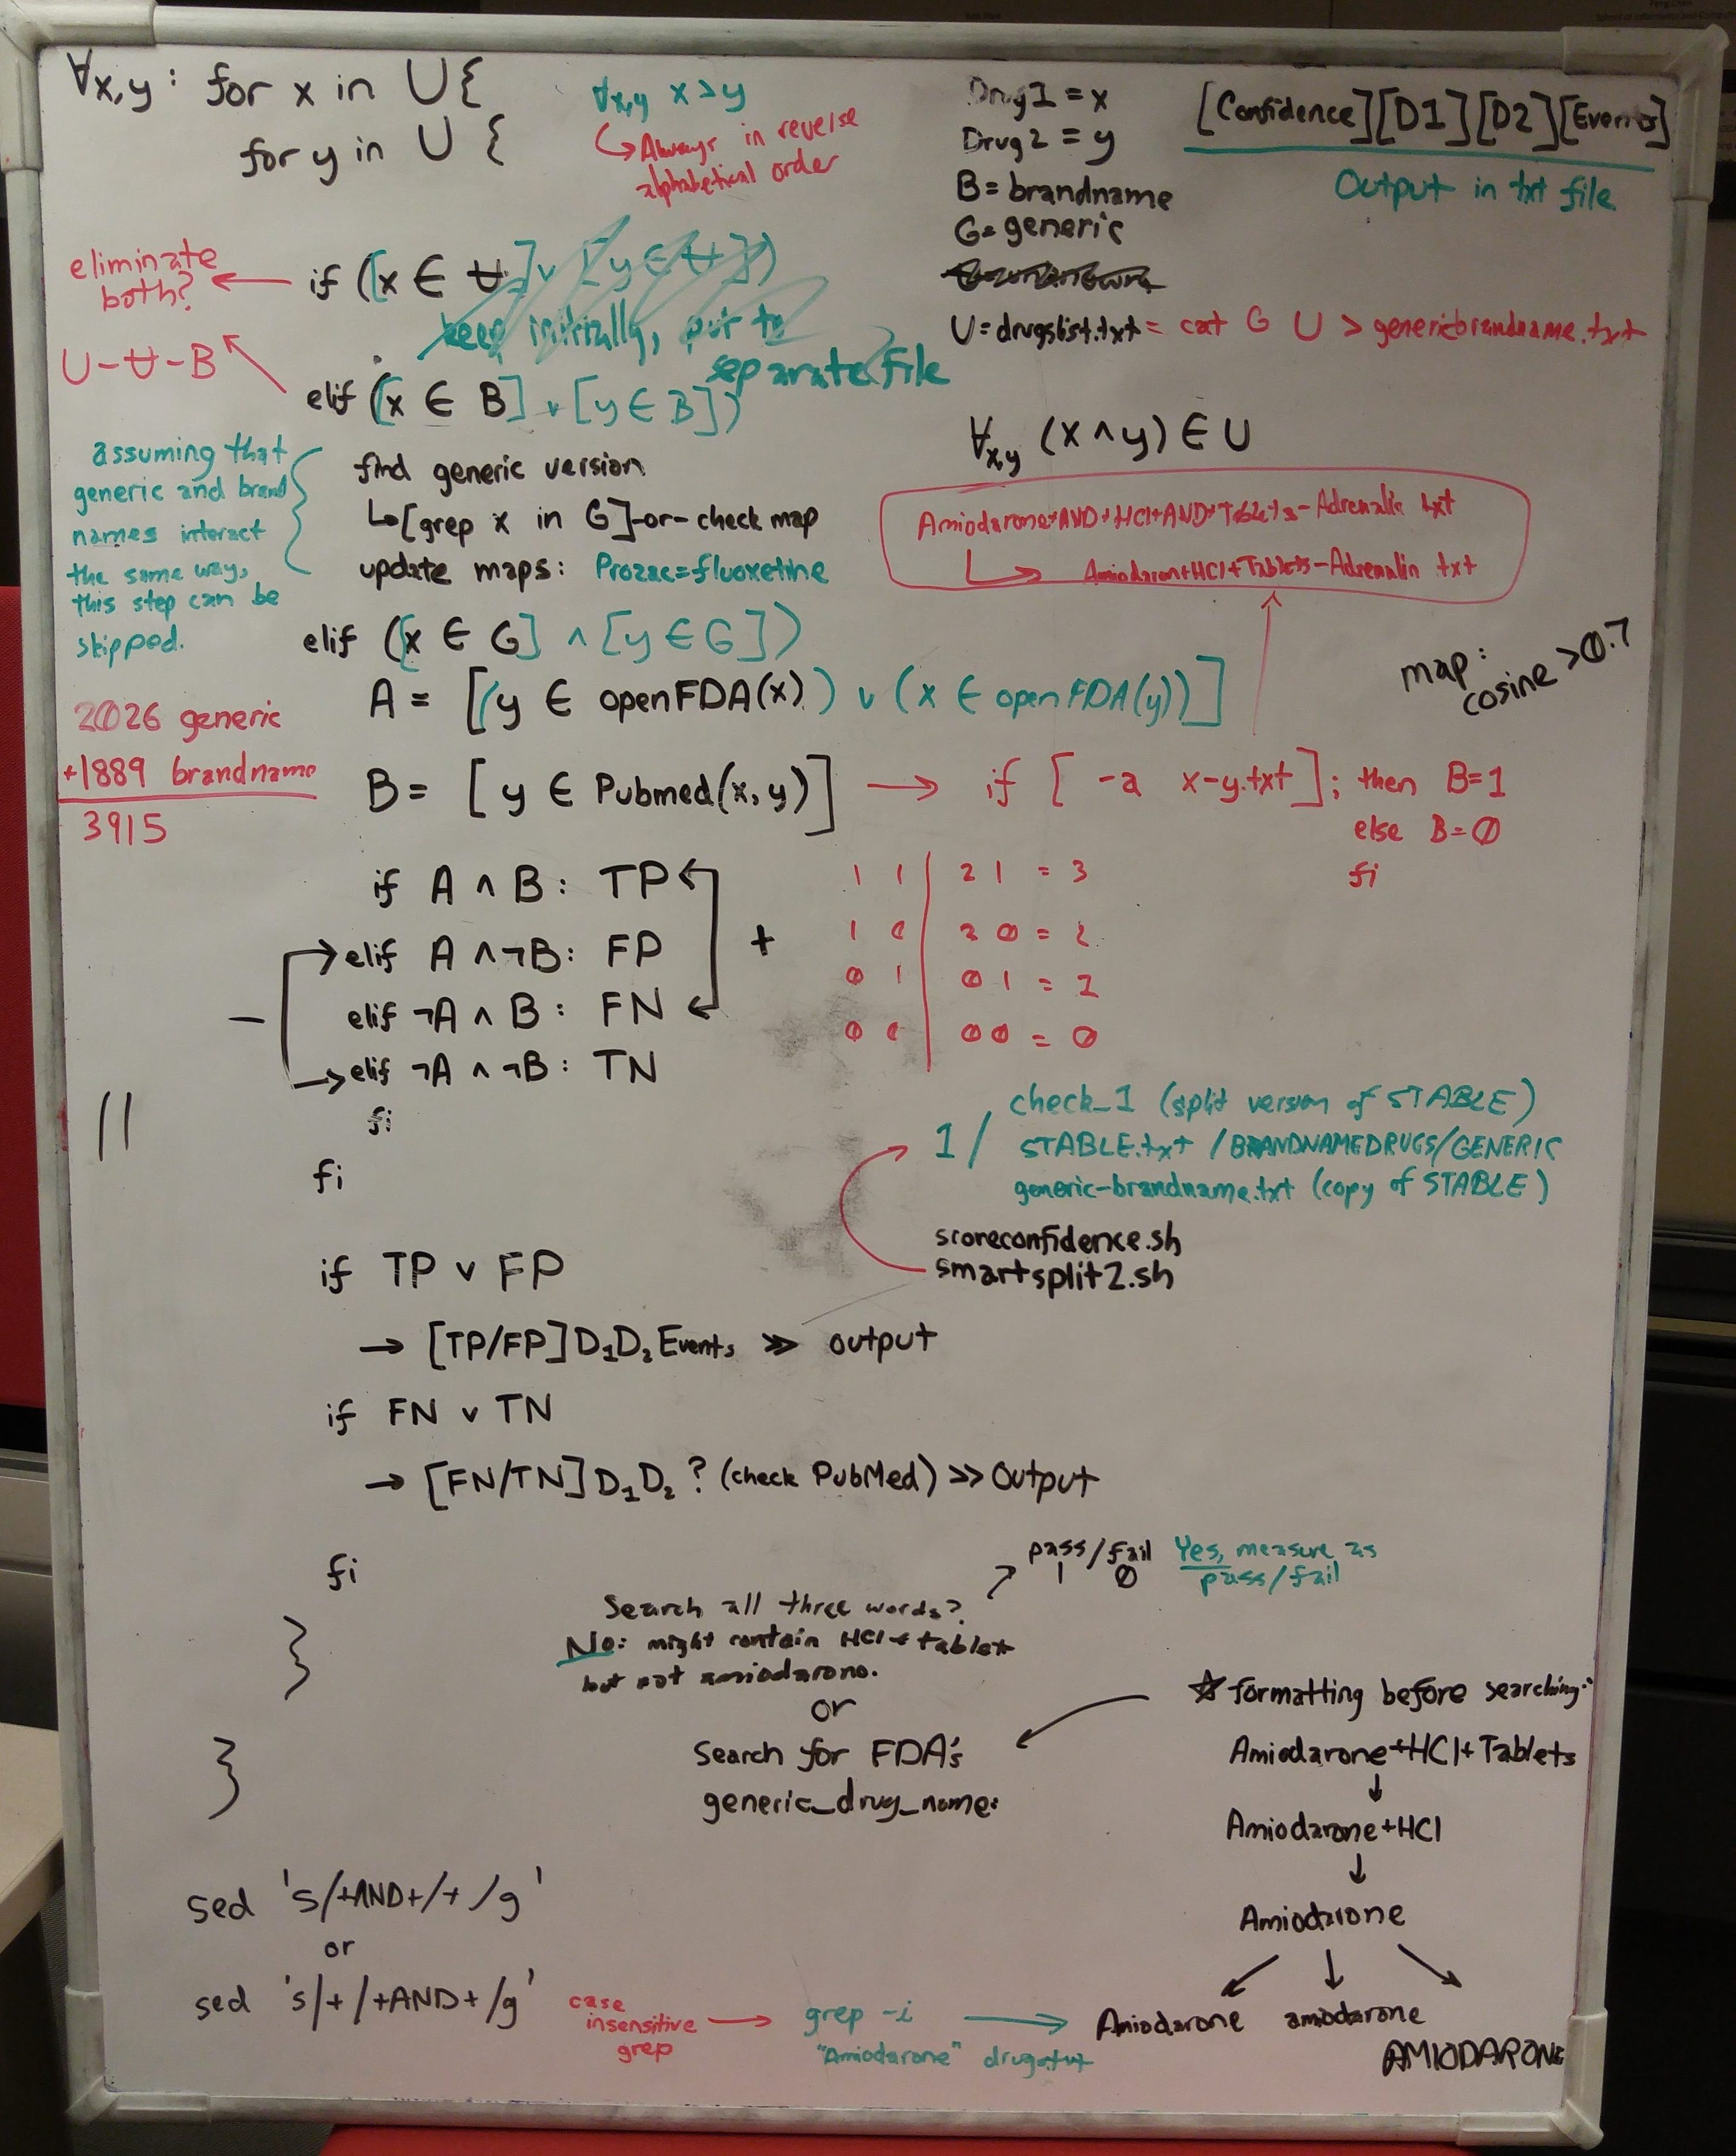
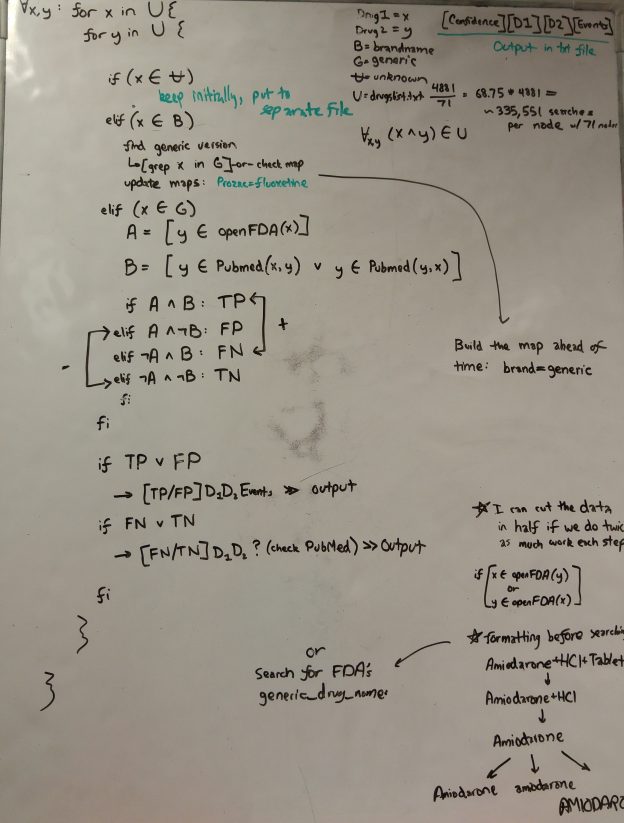
The core idea has not changed since Devendra and I formulated it: assign each drug combination a “confidence score” (in the form of True-Positive, False-Positive, False-Negative, or True-Negative) based on words that appear. Example: if drug1 appears in the openFDA information on drug2, and if drug1-drug2 was a combination found on PubMed. Over the last few days I made some fairly large changes.
- Of the 4881 drugs I’m tracking, 950 are classified as “Unknown” to openFDA. I’m predicting multiple possibilities for why this happens: errors in human labeling (i.e. brand/generic name are unspecified), the drugs were recently developed (openFDA data is updated quarterly), or my list of drugs contains medications not approved in the United States. While the exact cause will require further study, for simplicity I’m no longer considering these, and will focus on the set of brand name and generic drugs.
- Originally I thought that I would need to check every combination (~350,000 checks spread over 71 nodes), but similar to my realization for pulling abstracts, I can cut my matrix in half to reduce potentially redundant information (i.e. warfarin-amiodarone = amiodarone-warfarin). The important distinction is that I’ll need to check for Warfarin in Amiodarone’s openFDA page, and check for Amiodarone in Warfarin’s openFDA page. The run time will be roughly the same, but reduced to ~230,000 checks per node and creating a more manageable output file.
- Drug names have the format Amiodarone+AND+HCl+AND+Tablets, to check whether an openFDA page contains a drug, I’ll implement the check as pass/fail (1 or 0) based on whether all three words/phrases appear.
- There needs to be a map that shows which brand name drugs correspond to which generic drugs. To prevent redundancy in an earlier step (when I was pulling the openFDA information), information on brand name drugs and their generic equivalents was output to the same files. This simplifies the labeling process and alleviated some redundant information, but makes this part more complicated. To solve, I’m going to create a map using cosine similarity, or pull specific information from openFDA if necessary.
After wrapping up the preliminary work I spent some time on my poster. I had some rough ideas last week (and they are still rough), but after my Cytoscape progress last week I’m fairly confident that the data visualization will look nice.
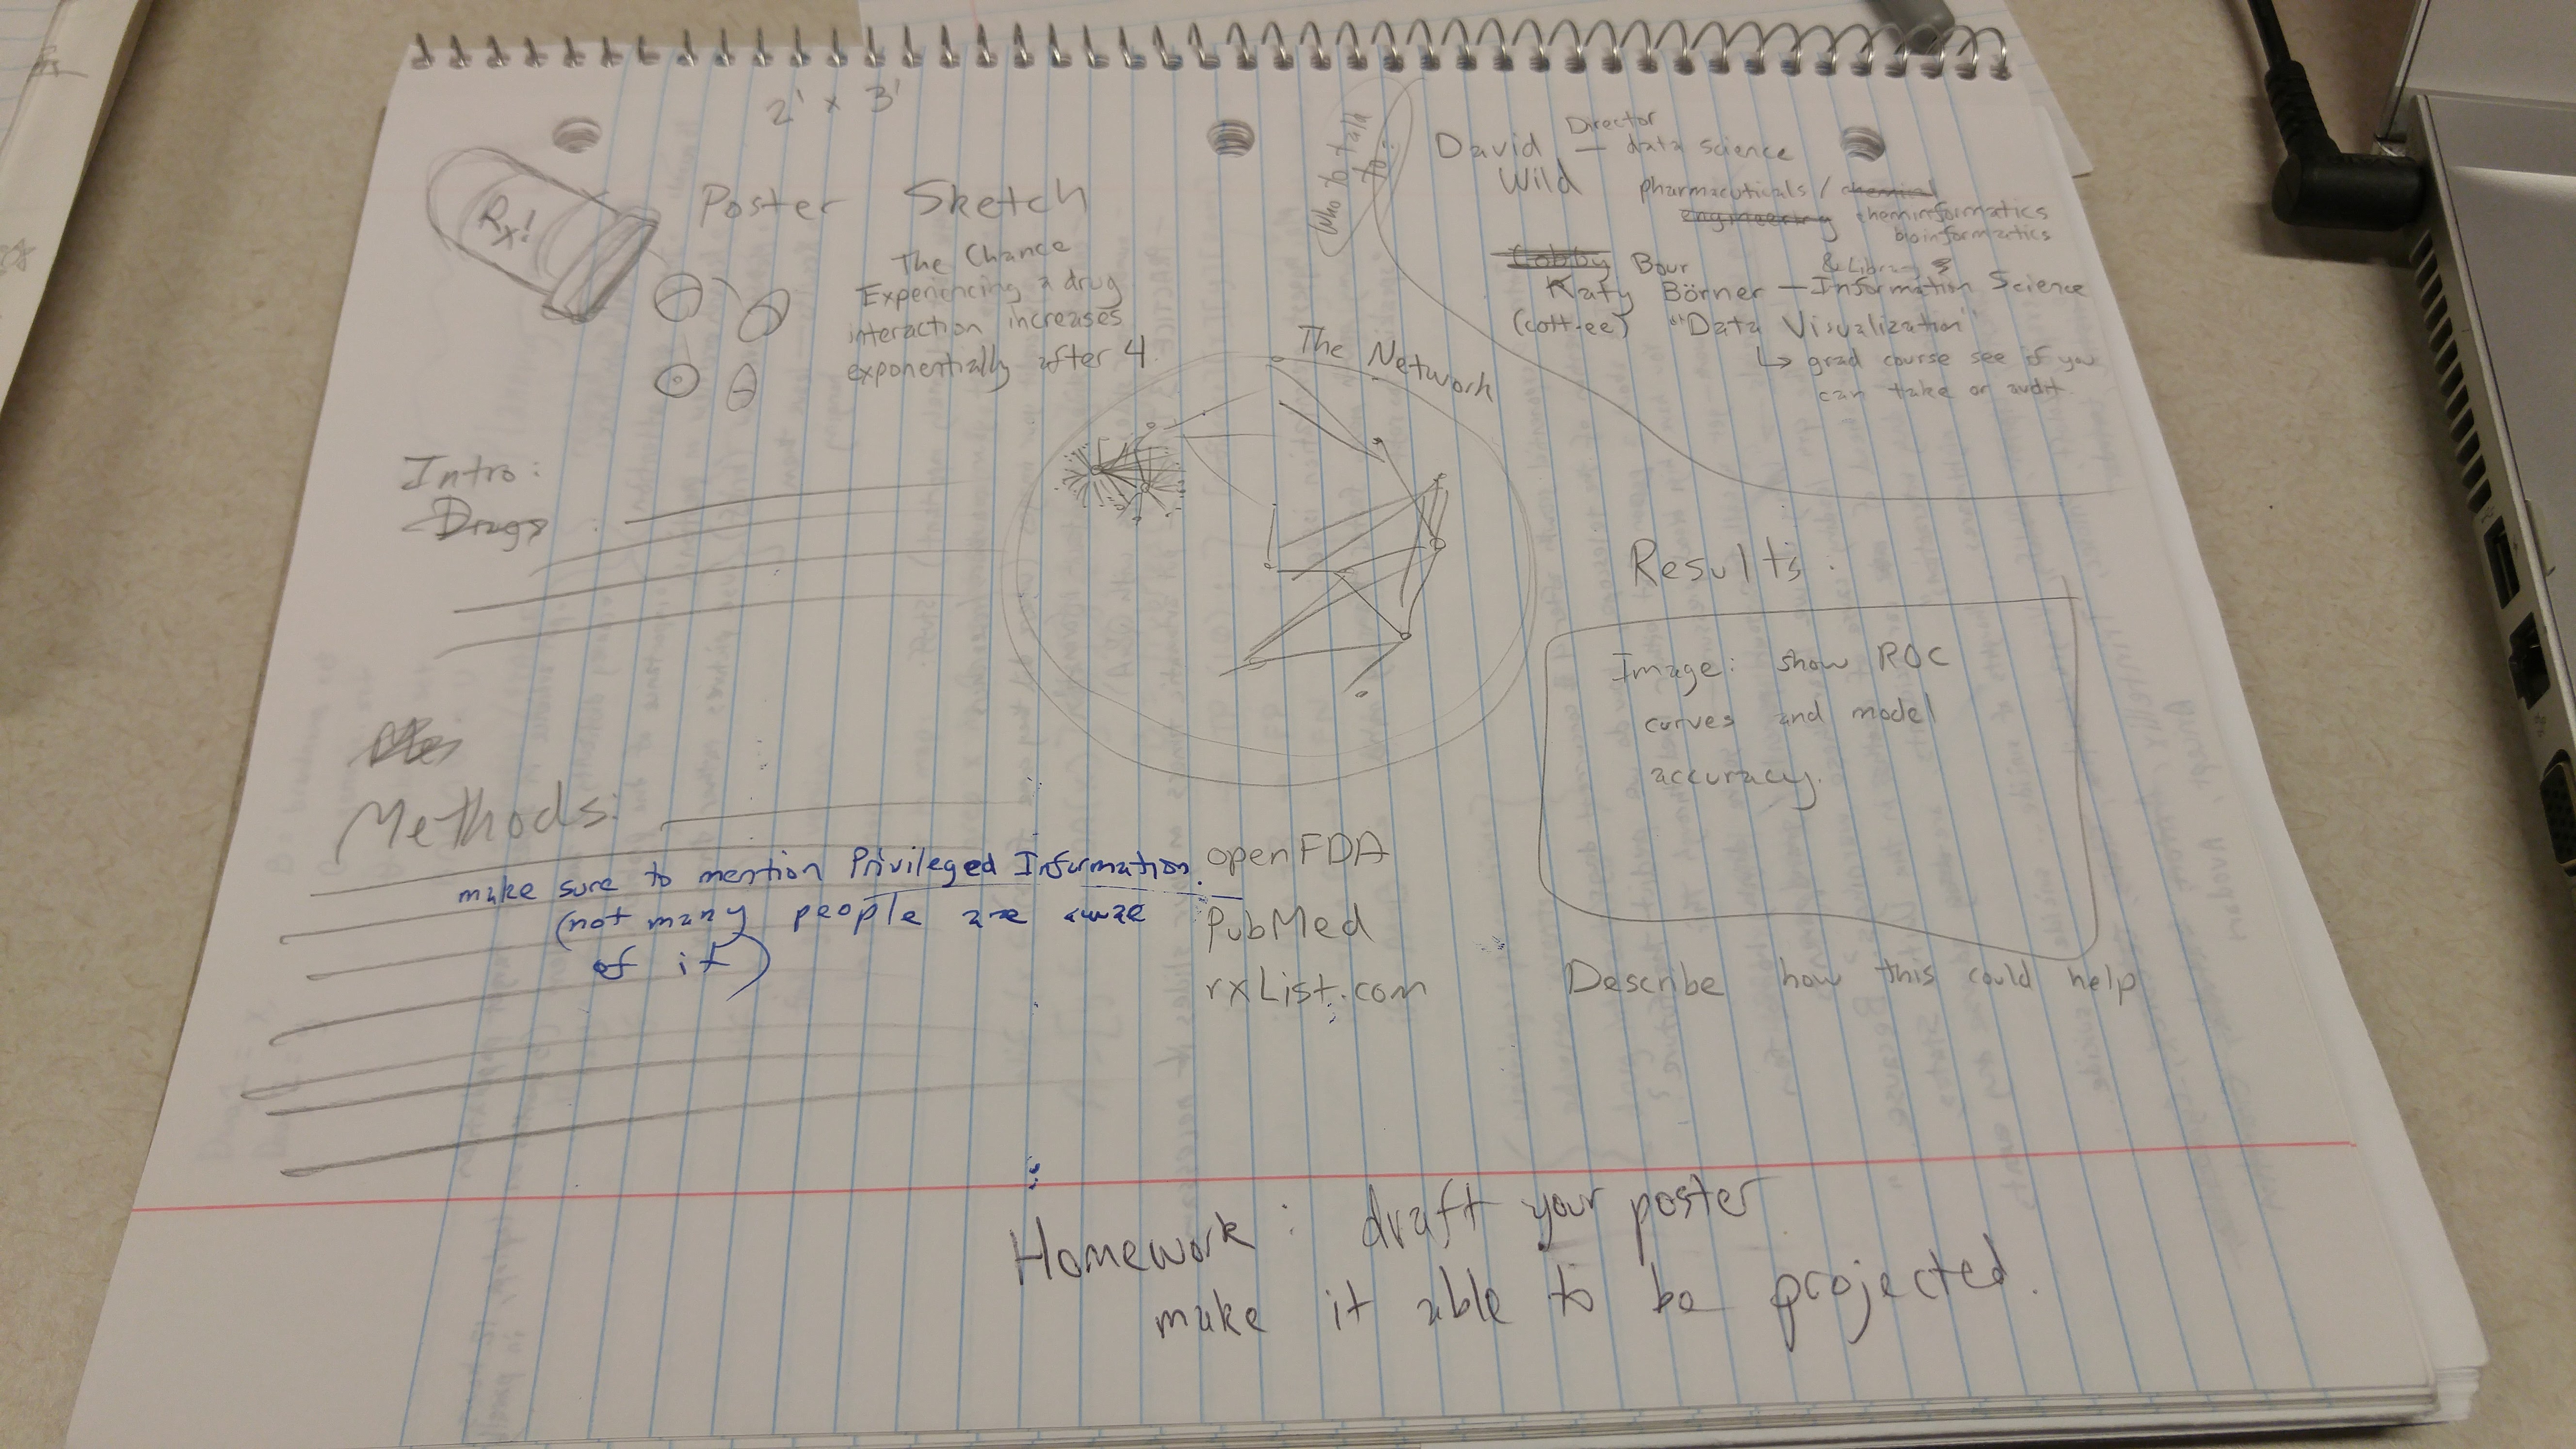
The poster will feature the interaction network in the center with background, methods, results, and other information surrounding it. I’ll need to summarize my scripts to make them readable and explain how they pull the data. The previous poster I made followed a research seminar I took with Professor Apu Kapadia, but I want this one to have a lot more pictures and diagrams.
STARAI met for reading group at 4:00pm, and at 5:00pm Dileep practiced his 3-minute lightning talk for a workshop he would be attending next week.
Savannah, Ciabhan, Devendra, and I met afterward to discuss progress. I explained my algorithm, Savannah updated us on selenium, and Ciabhan went into detail about interesting cases in the openFDA labeling (as follows):
| openFDA Contains | Reduce to |
|---|---|
| d1 interacts with d2, causing e1 and e2 | [d1][d2][e1,e2] |
| if you take d1, take d2 instead | [d1][NULL][NULL] |
| no interaction between d1 and d2 | [d1][d2][NULL] |
| d1 causes e1, e1 interacts with d2, which causes e2 | [d1][d2][e2] |
I did not consider some of these as possibilities (especially the [d1][NULL][NULL] case), my algorithm will likely remain the same, but the false positive rate will probably be significantly higher than I was expecting.
Devendra and I wrapped up the day by briefly discussing my poster.
Friday, July 8, 2016
I implemented cosine distance, and was overjoyed when I found out how easy it was to embed Python within a bash script.
My lightning was received positively. Devon received the crowd favorite vote, while Anne and myself received the Professor Connelly / Majdah award. I got ten dollars and spent it on a ticket to “A Midsummer Night’s Dream.”
Week 8
Week-at-a-glance (hours include time spent in the office):
| Date | In - Out | Total Hours | Minutes of Wall Sits | Caffeine Drank |
|---|---|---|---|---|
| Monday, 2016-07-11 | 7:45am – 5:32pm | 9hr47min | 3 minutes | 273 mg |
| Tuesday, 2016-07-12 | 9:35am – 7:12pm | 9hr37min | 0 minutes | 273 mg |
| Wednesday, 2016-07-13 | 8:14am – 5:41pm | 9hr27min | 0 minutes | 0 mg |
| Thursday, 2016-07-14 | 9:20am – 6:24pm | 9hr20min | 0 minutes | 0 mg |
| Friday, 2016-07-15 | - | - | - | - |
Totals: 38hr11min, 3 minutes wall-sits, 546 mg caffeine
I’m keeping my post short this week.
Monday, July 11, 2016
Continued working on the cosine distance script, but since implementation was worked out I focused heavily on input/output. Eventually this script would be used to match brand/generic drugs. I hit a couple road blocks toward the afternoon, the largest of which involved brand name drugs that were actually a combination of generic drugs (up to four or five).
Savannah and I worked on our paper into the afternoon. I wasn’t feeling well so I went home around 3:00pm and worked up until GRE prep started.
Tuesday, July 12, 2016
Spent the whole day working on Savannah and I’s research poster. I get really picky on how things look, but I was quite proud with how this version turned out.
Wednesday, July 13, 2016
I put some finishing details on the poster and submitted it by noon. I worked more on the script, making sure the pushes made it onto GitHub.
Most of the poster feedback had to do with the typeface size/readability, with some suggestions for intermediary images.
Professor Natarajan, Devendra, Savannah, Ciabhan, and I met at 4pm. We updated Professor on the direction of the project. He suggested moving directly onto the learning part (to ensure we could at least wrap up a paper by the time our REU finished), pointing me toward DeepDive, Savannah toward gradient boosting, and Devendra/Natarajan to continue on the neural network.
I read DeepDive documentation for a while and took the early steps to install it.
Thursday, July 14, 2016
Spent most of the day working on logos and graphics for Devon / Aislinn’s app.
Reading group at 4pm, discussing the paper “Statistical Predicate Invention.”
Friday, July 15, 2016
Robotics Competition, gone for the day.
Week 9
Week-at-a-glance (hours include time spent in the office):
| Date | In - Out | Total Hours | Minutes of Wall Sits | Caffeine Drank |
|---|---|---|---|---|
| Monday, 2016-07-18 | 8:25am – 5:40pm | 9hr15min | 0 minutes | 273 mg |
| Tuesday, 2016-07-19 | 8:48am – 5:06pm | 8hr18min | 0 minutes | 0 mg |
| Wednesday, 2016-07-20 | 8:33am – 5:45pm | 9hr12min | 0 minutes | 364 mg |
| Thursday, 2016-07-21 | 8:36am – 6:15pm | 9hr39min | 0 minutes | 0 mg |
| Friday, 2016-07-22 | 7:35am – 6:00pm | 10hr25min | 3.5 minutes | 182 mg |
Totals: 46hr49min, 3.5 minutes wall-sits, 819 mg caffeine
Monday, July 18, 2016
My morning began with working more on the icons for Devon and Aislinn’s SENSE app. After reviewing my progress from last week I was extremely dissatisfied with the results, I scrapped the designs and started over. Previously I scanned my paper copies and adapted them in Photoshop, with horrendous results. I started from scratch, using my designs as references but creating everything in Photoshop with much better results.
With a few complete, I jumped back into my main project, which had me reading through the documentation for DeepDive a little longer. Those who have been reading my blog entries for some time might remember the trouble I had getting Fedora installed on my laptop, I finally moved to my terminal choice and installed a copy with VirtualBox.
DeepDive installed fairly easily (run the command, get options)
$ bash <(curl -fsSL git.io/getdeepdive)
Installation seemed pretty straightforward, but the commands didn’t want to run. The quickstart guide didn’t seem to offer any specific recommendations for debugging, but after trying a few things I was under the impression that the PATH variables were configured incorrectly. Around this time I received a text from Savannah saying that her and Dileep were trying to get some scripts to run in the lab downstairs, STARAI’s weekly lab meeting would begin soon as well so I headed downstairs.
Savannah and Dileep were looking through the openFDA information, and filled me in on what the issues were.
- Dileep had a Python script (
makeTrainPredicates.py) for parsing the openFDA data.7 - The bulk of the work was handled by a Python package (
nltk– Natural Language Toolkit) nltkthrows a massive fit when non-ascii characters appear in the text files.
At the lab meeting, Sriraam introduced us to a representative from Crane, and each of us introduced ourselves and our work. Savannah and I walked through the order of operations to get everything to run properly, then I headed off to GRE prep.
Tuesday, July 19, 2020
Another morning spent working on icons. After some feedback from Devon, Aislinn, and Majdah I realized I left white backgrounds when blank ones would be more helpful. I cleaned up the previous ones and worked on the next set of questions.
Following what Savannah and I discussed yesterday, the steps seemed fairly straightforward.
- Convert the text files to US-ASCII.
- Install the nltk packages on Odin so we can parallelize the parsing.
- Write the script to run
makeTrainPredicates.pyin parallel.
I put in a request at the SOIC Help Desk at 11:00:56am, outlining the nltk
package and some recommendations on its installation.
At 13:29:23, I received the news that this would likely be impossible on Odin, and that the version of Python that was installed there wouldn’t be able to support it (after checking, I found that it was running Python 2.4.3 from March 2006; for reference, Python 2.7.3 was released in April 2012). Bruce asked how I planned to run my jobs, how many nodes I needed, and whether I had considered using Big Red II or the Karst cluster instead.
I sent my response at 14:06:14, outlining that I would use srun, allocate
around 50 nodes, and that I would consider Big Red II or Karst but wasn’t as
familiar with their Moab scheduler.
At 14:32:49, Bruce had the fantastic news that the package was successfully installed on Silo, Tank, and Hulk, and that I could run my code there so long as “you don’t fire up too many of them at the same time.”
I jumped onto Silo and pulled in the files I’d been working with. Sure enough,
nltk was waiting for me and I downloaded ‘punkt’ and
‘averaged_perceptron_tagger’ following Dileep’s instructions. There were a few
errors when I actually ran the script on Abacavir+Sulfate though, and after
combing through the traceback I found out there was another set of files I had
missed called ‘wordnet.’ Finding that was the issue was a bit of a challenge,
but fixing it was as simple as running nltk.download('wordnet').
With everything finally installed successfully I ran it again. The script was able to successfully split the files into sentences (1-2500), but seemed to crash when it tried parsing the sentences.
I went downstairs and talked with Devendra, during which I ran the script on the Fedora virtual machine to see if I could do some debugging. We put a plan together for the next few days.
Wednesday, July 20, 2020
Another morning, another set of icons. As an additional thing to fix, it turned out the Microsoft band used inverted colors (focusing on negative space instead of positive space). I altered a few of the images and sent them to Devon for testing.
I realized that since I was an undergrad I did not have access to Hulk or Tank, but wanted to do some testing on both to find out whether it was an issue with Silo I was experiencing yesterday. This was easily resolved after a couple more emails.
Technically there was another issue that I needed to resolve before I could run
makeTrainPredicates.py on any of the files. Almost all of the 2027 text files
contained unicode characters outside of the ASCII range. These could be almost
anything, some of the ones Dileep and Savannah found earlier in the week were:
(•, ≥, ≤, ’, é, ”, “, †, ®, –, ↓, ↑, ï, ™). When nltk encountered any of them
it would throw an error and stop executing.
Their original solution was to manually go through the documents and to find these characters, then add them to a list of symbols to remove from the document. Savannah mentioned trying to convert between encoding formats without any success.
To their point, I found out the hard way that converting between character
encoding was not an exact science. I was pretty sure the text files were in
utf-8 since they were copied from a website, but converting them from utf-8
into US-ASCII (iconv -f utf8 -t US-ASCII file) had no effect. Every file I
ran through still showed errors propagating everywhere.
After a decent amount of searching, the view sounded consistent that there was
not a perfect solution to this problem. I stumbled into a stackoverflow thread
that had a really interesting suggestion: sed -n 'l0' file. It seemed that
this would convert symbols into how they looked when sed read them: “•”
becomes “\342\200\242.” This still wasn’t perfect but it was a step in the
right direction.
When my Sharks Cluster access kicked in, I jumped onto both Hulk and Tank to test the scripts out on there. To my bitter disappointment, the same issue seemed to be occurring: the file could be split into sentences but nothing could be parsed.
Thursday, July 21, 2020
I skipped working on icons in the morning to get to Informatics, wanting to ensure that I could solve whatever was wrong with the scripts and put a solid dent into my weekly deliverables.
https://github.com/hayesall/DrugInteractionDiscovery
One of the big things that needed updated was the GitHub repository. Most of the scripts I had worked on were still filed under my IU GitHub, but the documentation and other pieces needed to be stored under the ProHealth GitHub page.
I spent quite some time working on the README.md for our page, ensuring that there was effective documentation for each script.
At 1:30pm I met Devendra to discuss how to precede since running the Python scripts looked fairly hopeless. He also thought it was strange that the files weren’t being parsed properly, but recognized that we had limited time for solving this problem. We decided to start with a subset that Savannah and I could process on our physical devices over the course of a couple days. I had a dataset of the top specialty drugs, drugs by cost, and most prescribed drugs from a fortune 500 company. Out of those I selected 51 drugs that we had solid information about, and copied them into a separate folder to focus on.
-
If I do have some extra commentary to provide, I’ll add them in the footnotes, like this. ↩
-
Universities tend to free up DNS records or remove old content when people graduate or leave. This makes sense, but has also meant that I’ve had to scour Internet Archive’s Wayback Machine on more than one occasion looking for defunct pages previously hosted on university servers. ↩
-
Our first week was a “Research Bootcamp.” Katie Siek brought our cohort up-to-speed on as many topics as possible, which included “how to blog.” Most of the entries during Week 1 consist of short summaries of papers, notes on tools, or short reflections on things we discussed. This was partially to get us accustomed to writing about our experiences, since this would be a critical part of our documentation going forward. Later I would assist in this same process with new REU students: sharing my knowledge on managing research, specifically with data management and version control with Git. ↩
-
The Odin server was discontinued at some point, but at the time of writing (2020-11-24) many of Indiana University’s pages on Slurm scheduling still refer to it. ↩
-
In other words: the synchronization method used sleep sort. ↩
-
Several people have worked on various parts of this since, see the Starling Lab “Logistics” project page. ↩
-
Dileep Viswanathan and Rahul Pasanuri were Masters students working on a separate project at the time for doing information extraction on financial documents (specifically SEC Form-S1 Documents for initial public offerings: I created a version of this data set called Financial-NLP). When they graduated, Kaushik Roy and I took that project over and the ‘makeTrainPredicates’ script was generalized into a Python package named ‘rnlp’. Many parts were generalized considerably, but most of the early ideas remained—consider this group of lines for extracting predicates based on position in a sentence: the code is remarkably similar between the version Dileep gave to me and the version Kaushik and I generalized it into. I wrote some more general notes motivating relational learning on text to accompany rnlp’s documentation. ↩