We rarely notice that we live inside an invisible layer of liquid heat. It’s obvious that this invisible heat exists–we bundle up in layers of clothing when there is too little, and we sweat when there is too much–but these responses are mostly automatic. Having access to 24-hour weather forecasting helps us plan what to wear, decide to bring an umbrella, or put on boots in the morning.
But what if I want to know the temperature exactly where I stand? Smartphones have a huge number of built-in sensors, but the best estimate my phone is capable of uses readings from the nearest weather station. Weather Underground and similar sites are making local stations more ubiquitous, but not quite to the level of personalized temperature sensing.
Rob M. Long proposed a short study to try and peek into this question with an activity for learning about different research methods within Professor James Clawson’s “Field Deployments” course.
This will describe some of the hands-on portions of the data collection and analysis. A shorter overview and all code is available on my GitHub.
Prototyping to collect data
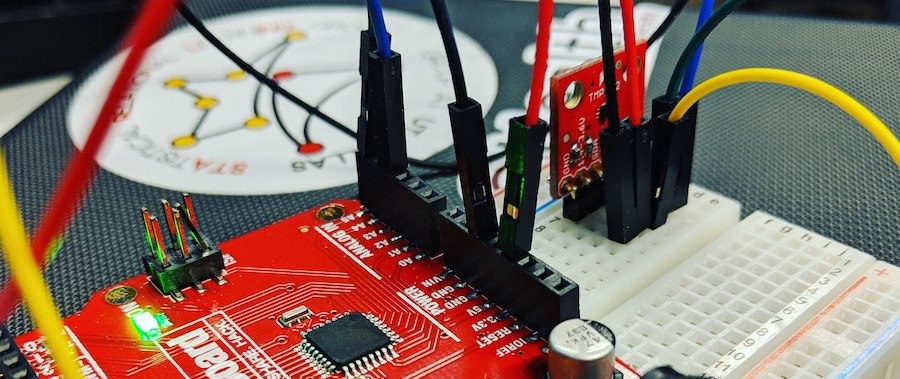
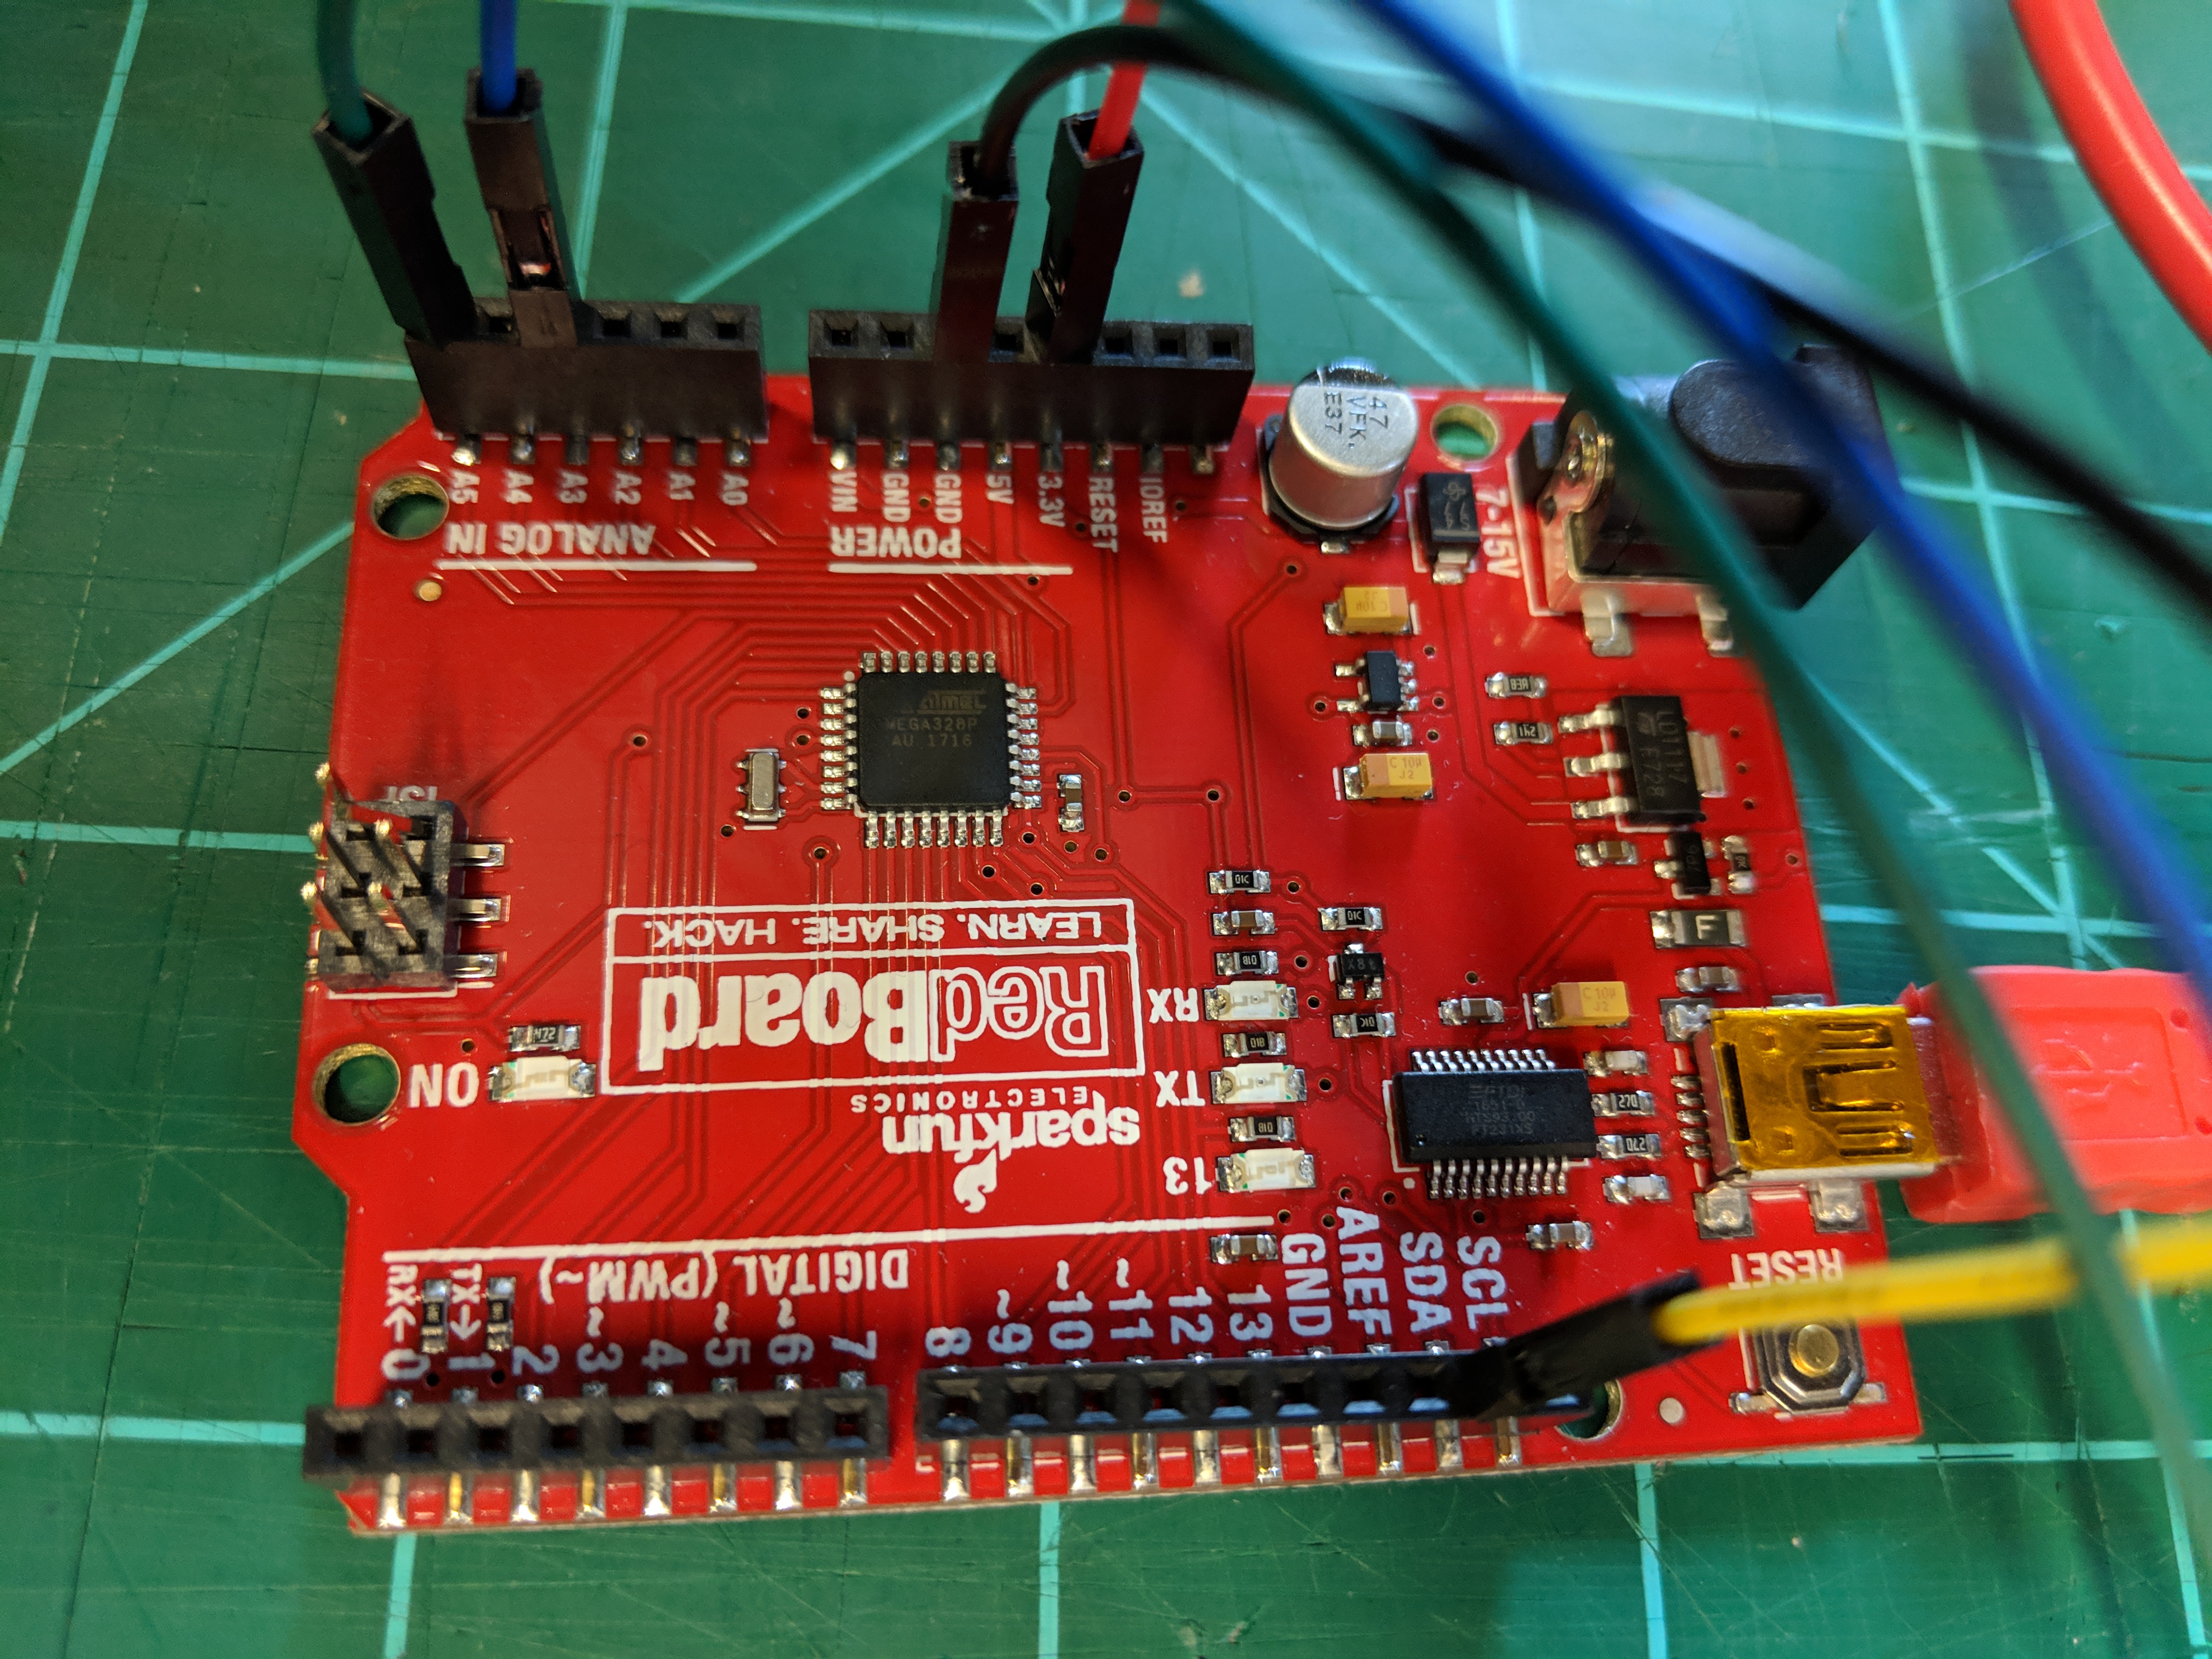
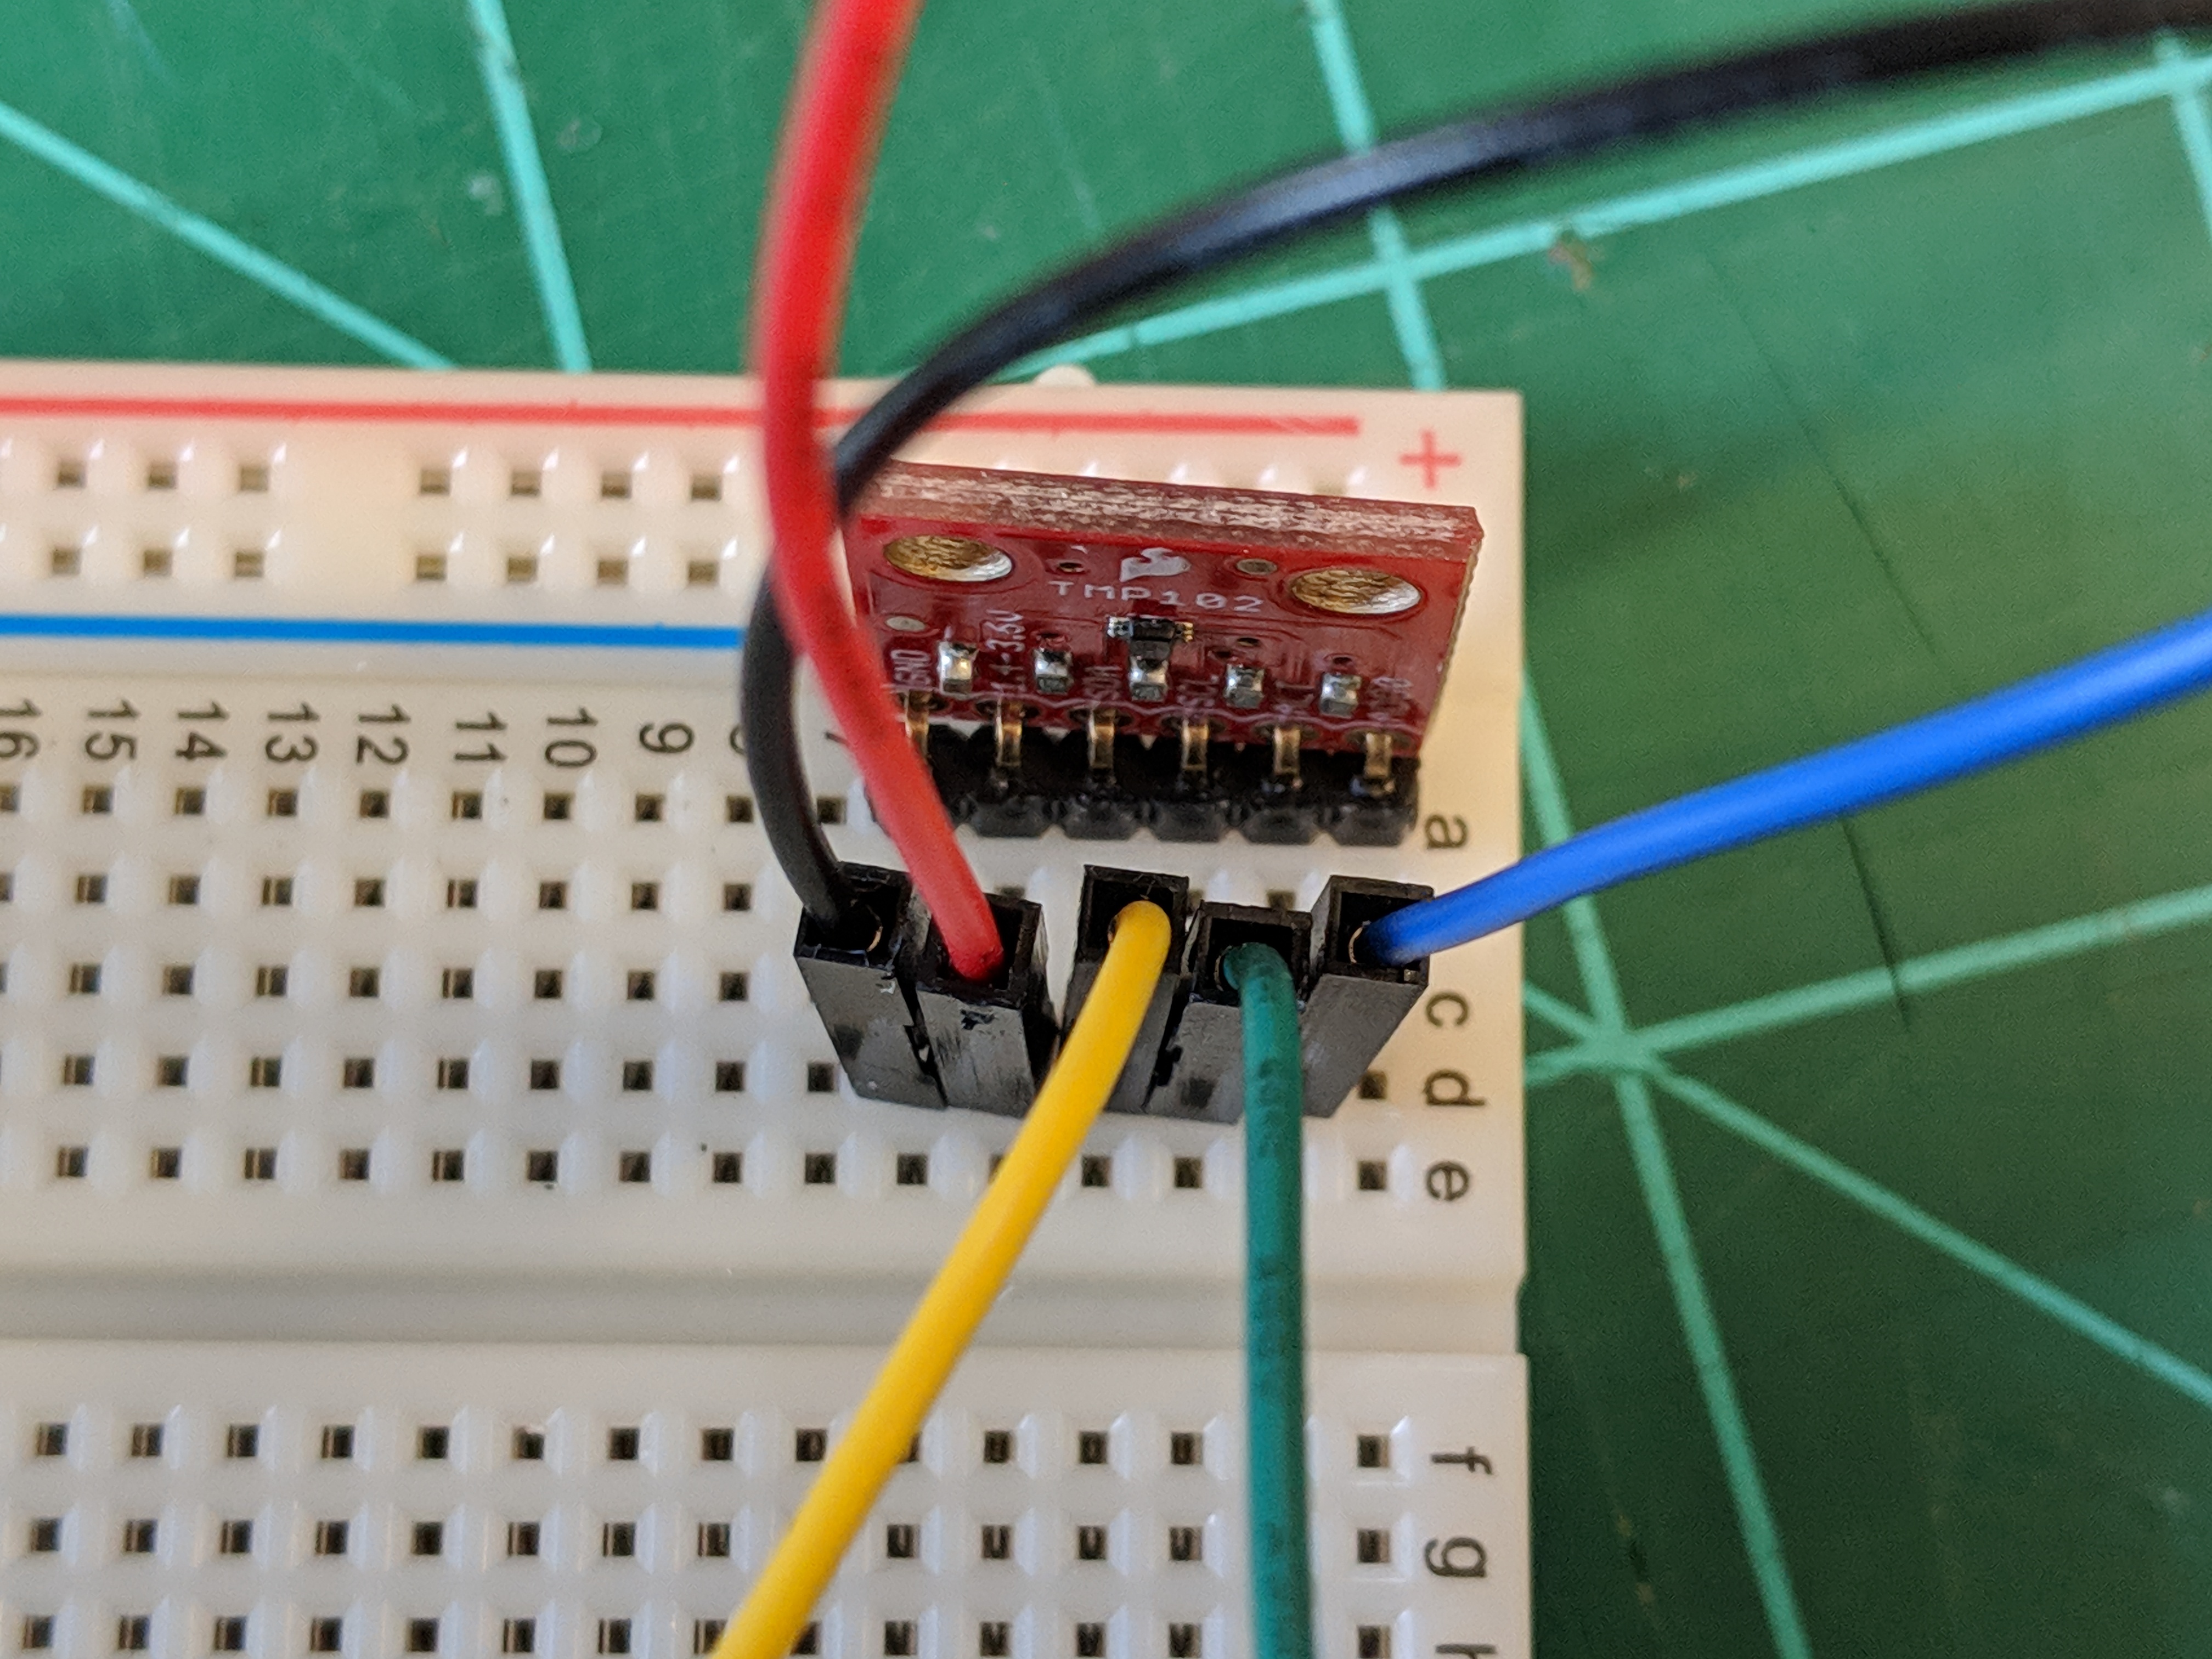
This used a SparkFun RedBoard for control and a TMP102 Digital Temperature Sensor. Setup closely followed the TMP102 Hookup Guide, with minor differences in the wiring and tweaking the output so it could be viewed from my laptop.

The wire colors are not important, but I listed them in the schematic so they would be the same as they were in the photos.
Code and Study Assumptions
#include "Wire.h"
#include "SparkFunTMP102.h"

TMP102 sensor0(0x48);
int startTime = 0;

void setup() {
	Serial.begin(9600);
	sensor0.begin();
	sensor0.setConversionRate(0);
	Serial.println("Time,TemperatureF");
}

void loop() {
	float temperature;
	sensor0.wakeup();
	temperature = sensor0.readTempF();
	Serial.print(startTime);
	Serial.print(",");
	Serial.println(temperature);
	sensor0.sleep();
	delay(2000);
	startTime += 2;
}To understand some of the local temperatures in and around the IU Informatics building, we decided to record temperature at a few different locations and occasionally record while doing a specific activity.
- ProHealth Office: sitting at my desk
- Outside: walk outside the building, then sit at a bench
- A Classroom: dim the lights and sit
- The Breakroom: put the sensor in the refrigerator
- A stroll through the building
There are a few limitations of this approach. Most obvious is that this requires carrying a laptop everywhere (which is far from the most user-friendly approach), and that time is measured as the number of seconds since a discrete starting point (which would make this difficult to synchronize with other people or monitoring stations).
Results
The figure below represents each of the five locations. The x-axis shows the number of seconds after 12:00:02 EST on Monday, April 8, 2019. The y-axis shows the degrees Fahrenheit during each window, and labels the activity.
Horizontal lines were added to show certain time points which may be of interest, such as when I arrived at an outdoor bench and when I left the bench.
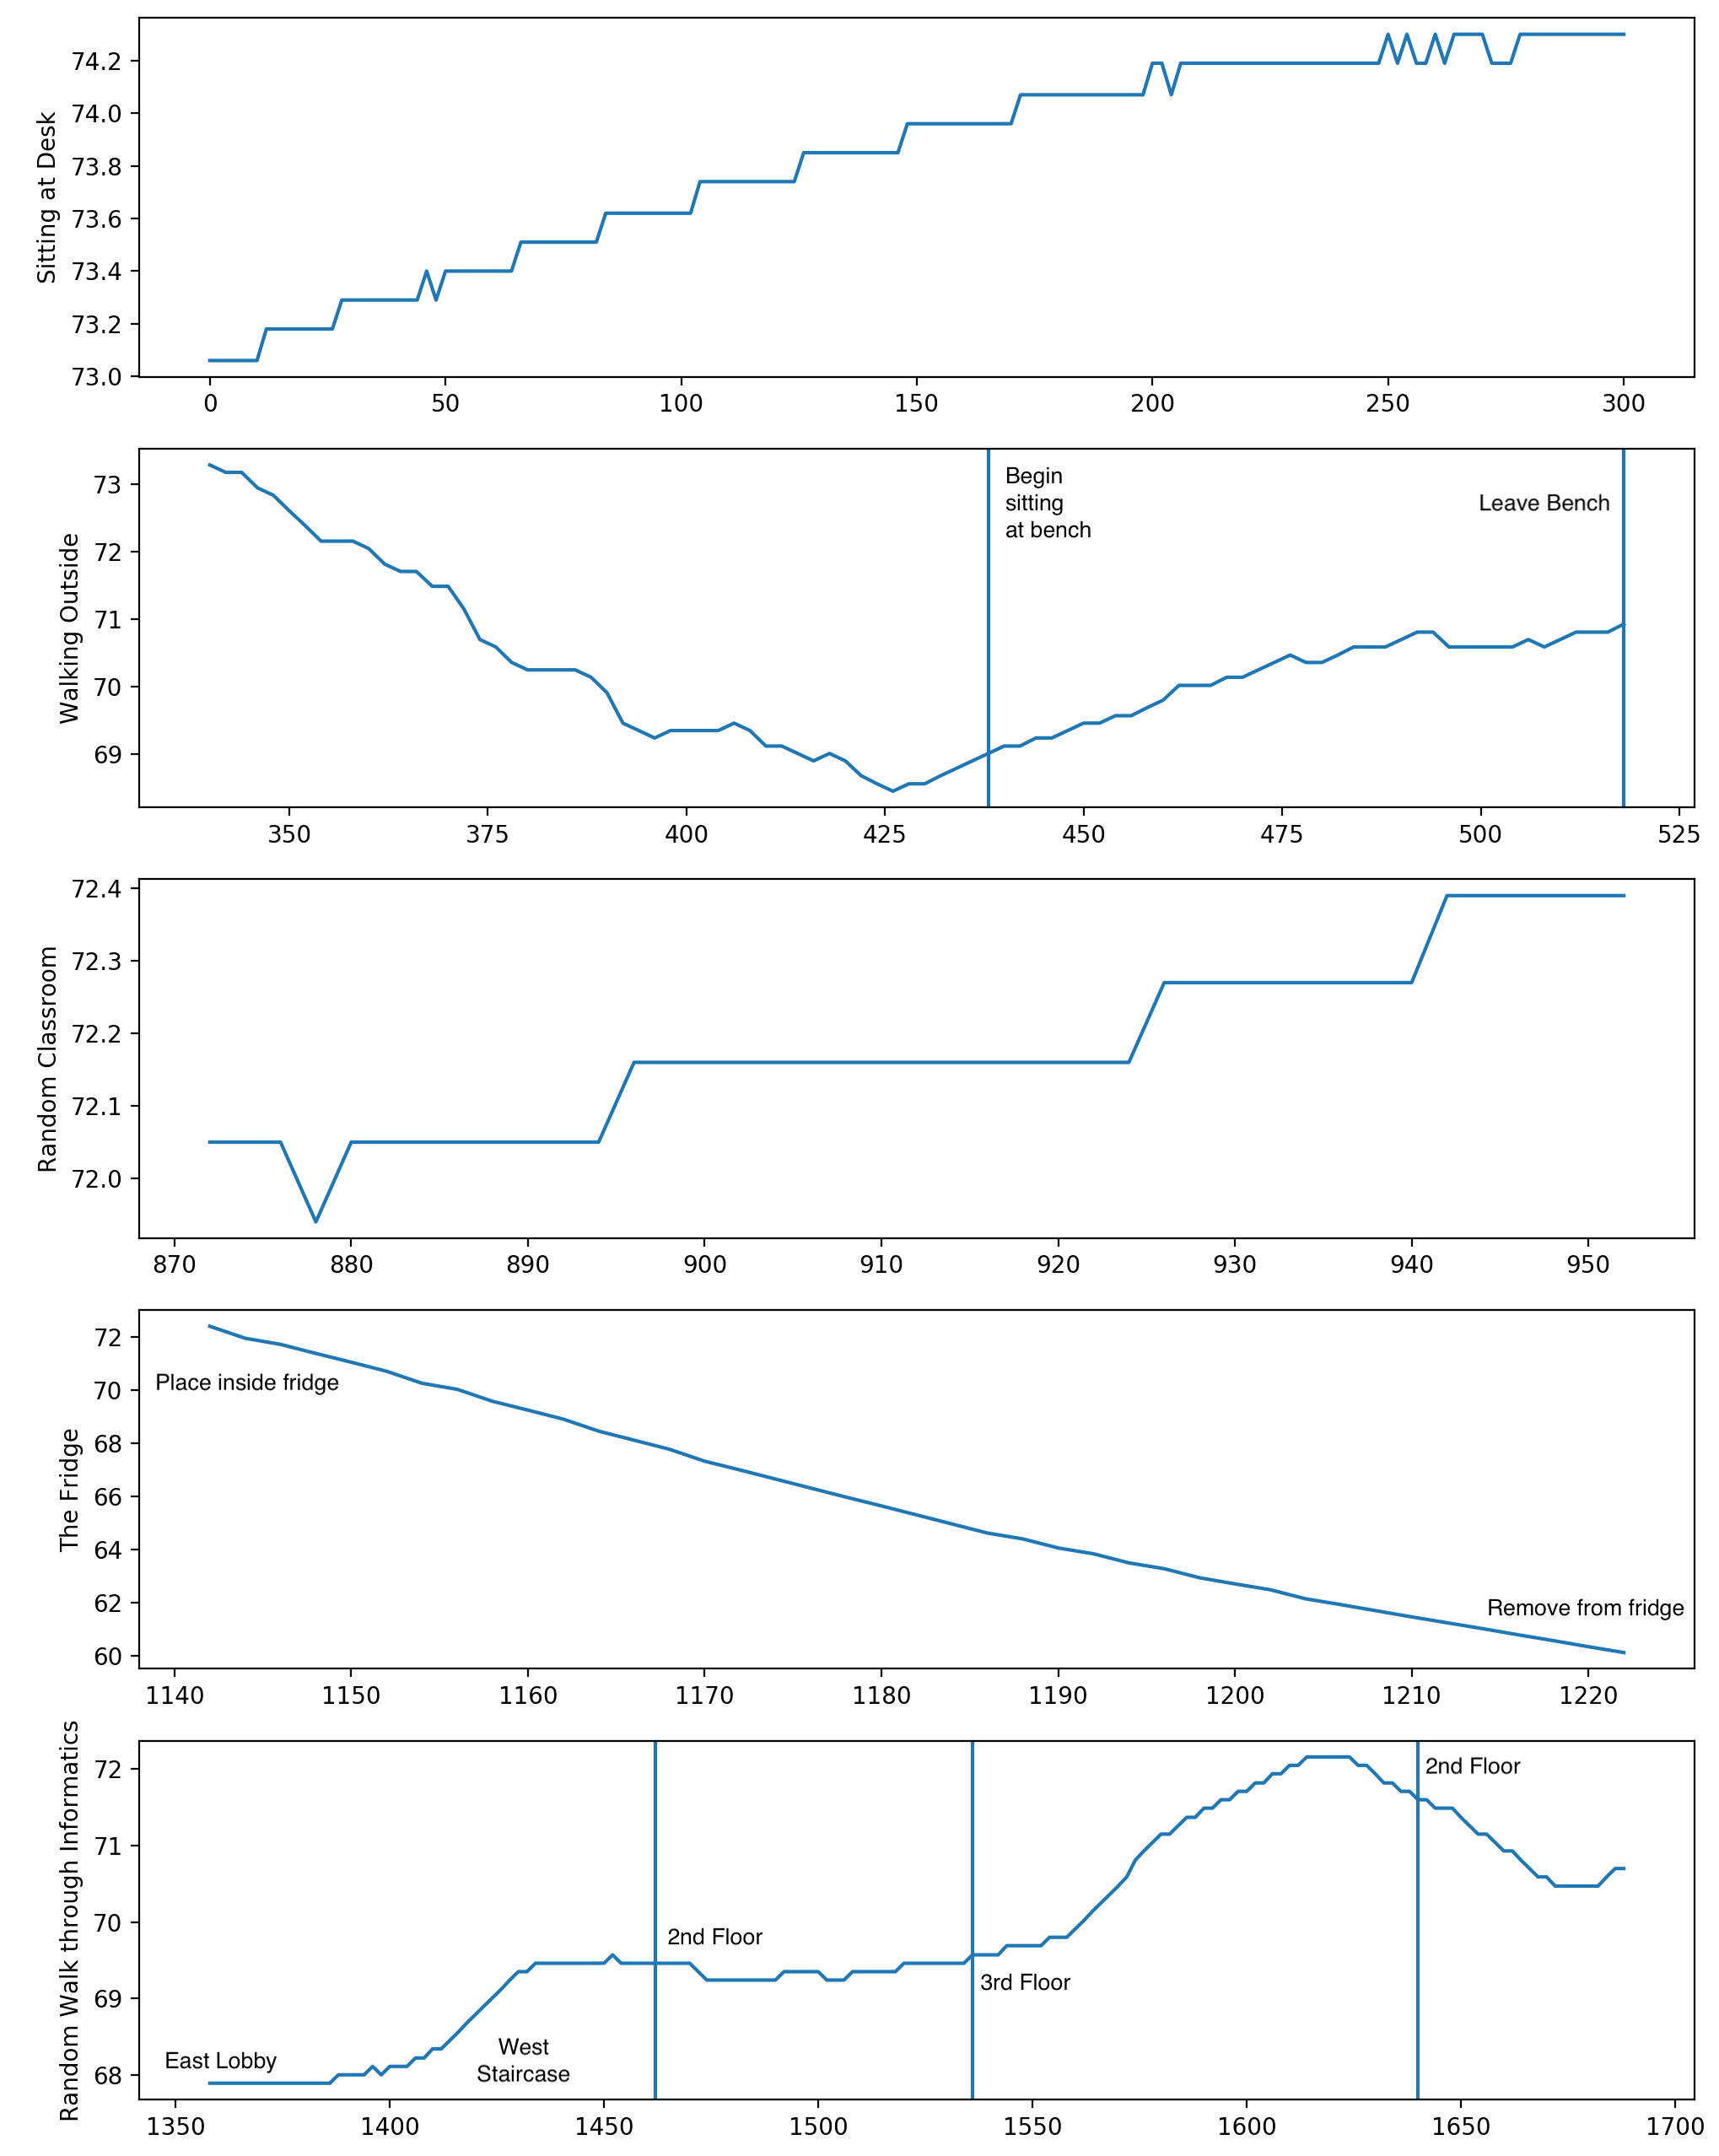
The plot that I found most interesting was the last one, when I walked through the building. While I walked, I took note of where I was at certain points in time, such as when I moved from the second floor to the third floor.
On this particular day, I noticed the third floor seemed warmer, and this appeared to be reflected in the measurements. When I arrive on the third floor, the temperature begins rising—when I leave the temperature begins falling.
Future Work and Further Reading
This window into a personalized temperature profile could provide much richer information about a person’s local environment. Simply reporting the readings of the nearest weather station may be extremely unreliable for this sort of task: the nearest station may report high outdoor temperatures, but in reality a person could be in an air-conditioned office. On the other end of the spectrum: it could be freezing outside but a person may be washing dishes in an extremely hot kitchen.
The Healthy Cities Lab at the IU School of Informatics, Computing, and Engineering does really interesting work at the intersection of personalized sensing and environment monitoring. Check out some of their work if you found this interesting!